An impressionist density plot uses different shades of various colors to encode univariate density estimates. Traditionally, histograms have been used to display univariate density estimates; hence, they are used here as a starting point to introduce impressionist density plots.
The following is a trellis of histograms with each panel displaying a DNA profile
from one of the 8 wells in an HCS experiment: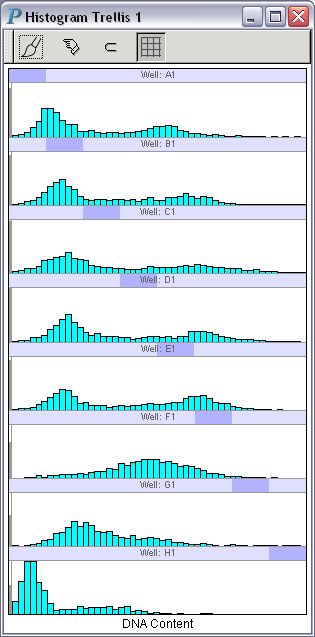
This trellis of histograms can be redisplayed through
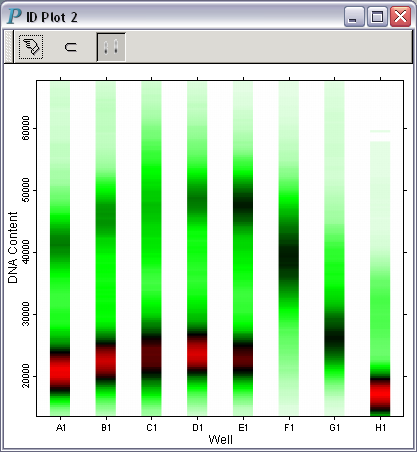
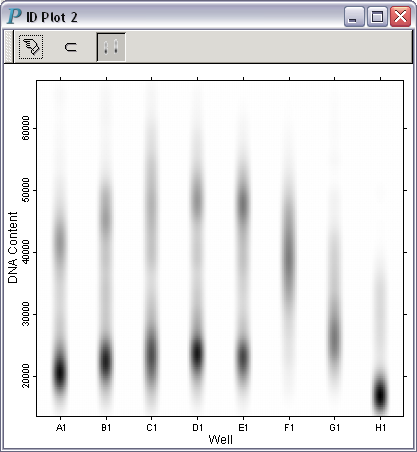
several impressionist density plots
to view the data from different perspectives: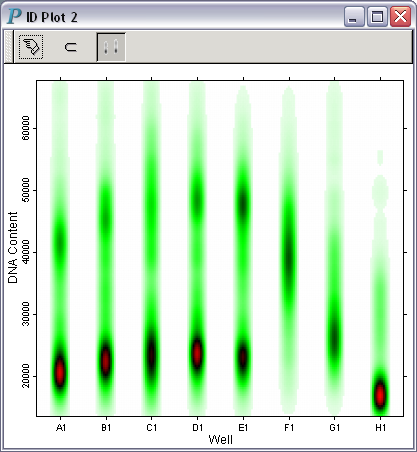
Multiple impressionist density plots can also be displayed in a trellis.
For example, Fig. A below
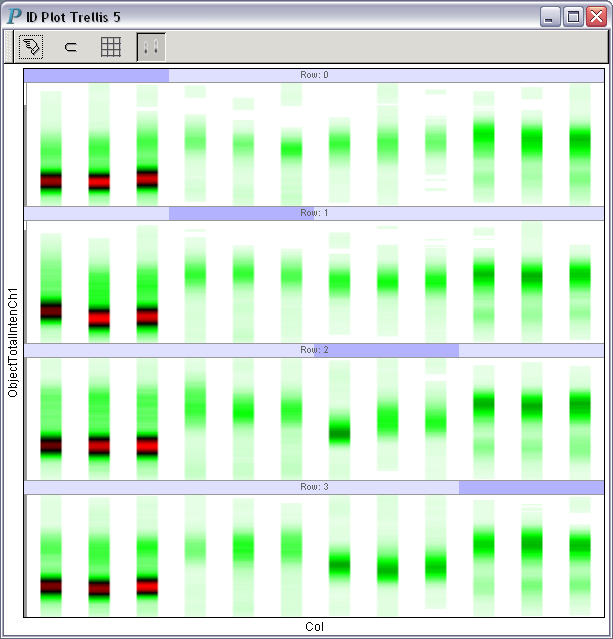 |
| Fig. A |
is a trellis of impressionist density plots based on the same high-content screening data as that in the following Fig. B:
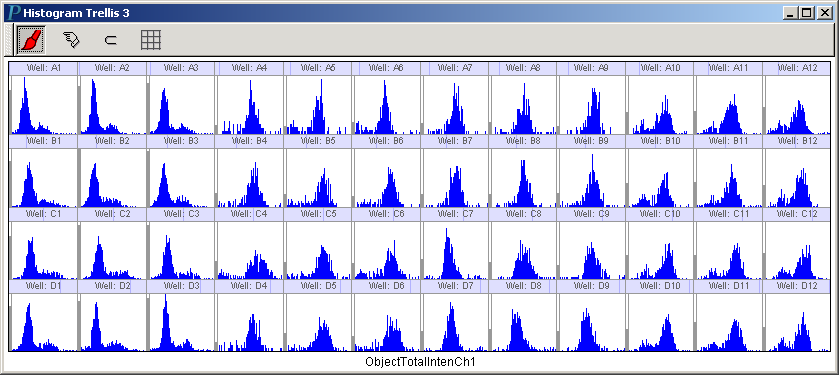 |
| Fig B: A trellis of DNA profiles |