Parallel coordinate plots (also known as profile plots) take a unique approach to draw high-dimensional data. Since plotting more than 3 mutually perpendicular axes is impossible, parallel coordinate plots draw all the axes parallel to each other and equally spaced in a 2D plane. Depending on whether these axes share the same common scale or not, there are 2 ways to draw a parallel coordinate plot, as illustrated by the following 2 parallel coordinate plots based on the same data set:
This parallel coordinate plot uses a common vertical range that encompasses all the values of all the variables being visualized.
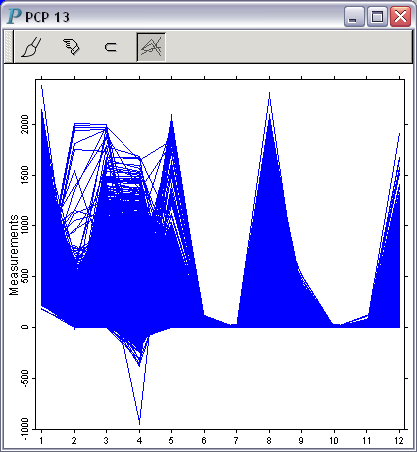 |
| Fig. A: All axes share a common vertical scale |
Each axis in this parallel coordinate plot uses a different scale so that the minimum and the maximum values of the variable represented by an axis are mapped, respectively, to the bottom and the top of the available drawing room.
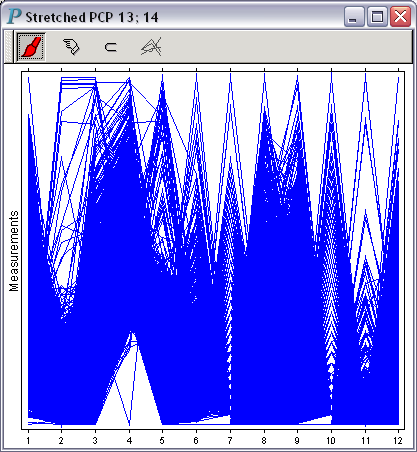 |
| Fig. B: A stretched parallel coordinate plot |
Panmo uses parallel coordinate plots as the launch point for several utilities that help users find similar or dissimilar observations.
Acknowledgements: Data courtesy of Invitrogen.