A Tukey sum-difference plot allows users to study more effectively the deviations of data points from the 45-degree line y = x.
A scatterplot with the line y = x drawn inside is frequently used to compare 2 variables. It is the vertical deviation from a point to the line y = x that matters here, not the shortest distance from a point to the line y = x. It is hard to compare the vertical deviations of the points from the line because the non-zero slope of the line y = x affects our visual perception.
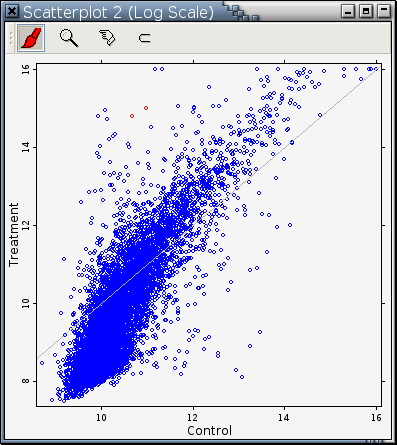 |
| Fig. A: A traditional way to compare 2 numerical variables |
A Tukey sum-difference plot is the result of rotating the point cloud in a scatterplot 45-degree clockwise followed by an expansion of the vertical scale. It allows users to study more effectively the deviations of the points from the line y = x.
It is much easier to compare the 2 red points in the Tukey sum-difference plot in Fig. B.
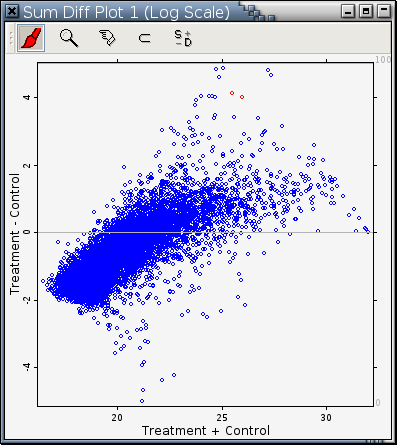 |
| Fig. B: A Tukey sum-difference plot |