Data:
This data set is from an HCS experiment to characterize how camptothecin affects cell cycle progression.Assay
Cells are treated with camptothecin for 24 hours at a gradient of concentrations: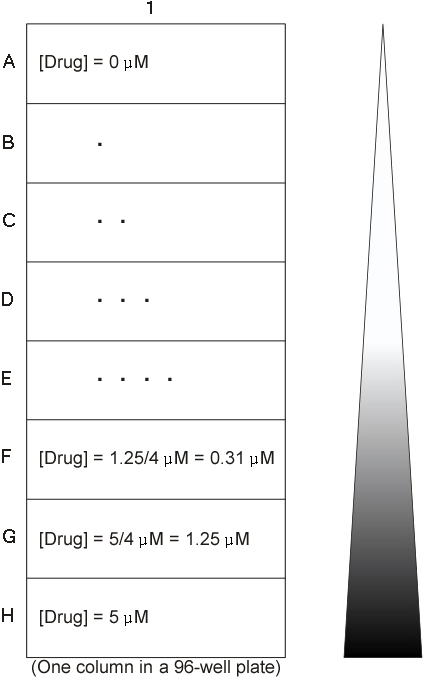
Readout:
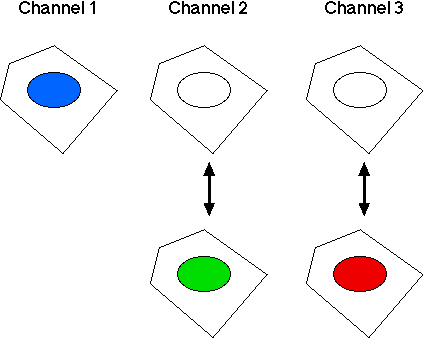
Three cellular parameters are monitored:- Channel 1: DNA stain (nuclear stain intensity; DNA content).
- Channel 2: Cellular target 1, p53, (nuclear stain intensity). The response of p53 is that its level in nuclei goes up or down.
- Channel 3: Cellular target 2, pRb, (nuclear stain intensity). Its response is just like that of p53; its level in nuclei goes up or down.
DNA Content
Since we are looking at the effects of a cell cycle drug, the first thing to look at would be the DNA content, our first channel. In the following 27-second video, we create a trellis of histograms of DNA content.It is clear from the trellis graph of DNA content in the video
that camptothecin has different effects on cell cycle progression
at different concentrations.
The "2N" and "4N" peaks are quite distinct
in the the upper 5 panels.
The distribution of DNA content in each panel also spreads out
quite a lot.
This is because the particular cell line used in this experiment
shows a wide range of chromosome numbers.
The 2nd Channel, p53
In the following 12-second video, we use a boxplot to visualize the effect of camptothecin on p53.The boxplot in the video clearly shows that the level of p53
in nuclei increases markedly at higher concentrations of camptothecin.
The median of the H1 well is 4 times bigger than the median
of the A1 well.
The 3rd Channel, pRb
Much like we did for the second channel, we can get a boxplot with Well as the X variable and Nucleus Intensity (pRb) in log scale as the Y variable:
This boxplot clearly shows that as the concentration of camptothecin goes up, the level of pRb goes down.
Point to Ponder
If the expression level or phosphorylation state of a cellular protein changes in different phases of cell cycle, does it make sense not to examine a target protein in terms of the phases of cell cycle?In the rest of this tutorial, we'll take cell cycle into account to see how p53 and pRb are affected by camptothecin.
Dividing Cells into 3 Categories Based on DNA Content
Here we will divide all cells in this experiment into 3 categories:- Those in the 2N phase of cell cycle,
- Those in the 4N phase of cell cycle, and
- Those in the S phase of cell cycle.
What we just demonstrated in the above video is essentially equivalent to
creating on the fly a new categorical variable with 3 categories:
- Blue (cells in the 2N phase of cell cycle)
- Green (cells in the S phase of cell cycle)
- Red (cells in the 4N phase of cell cycle)
Visualizing p53 Responses in Different Phases of Cell Cycle
Now we have divided all cells into 3 groups, each corresponding to one phase of cell cycle. We can visualize this information on p53 responses, phases of cell cycle, and drug concentration with a trellis of boxplots. Because Panmo treats each plot as a viewport into the data space and allows us to retrieve any data visible in a viewport, we can use the data in the histogram at the end of last video to make this trellis of boxplots. The following video runs for 1 minute.It's clear the patterns in the G1 and H1 panels (subject to the
highest camptothecin concentrations) are distinctly different from
those in other panels.
Visualizing pRb Responses in Different Phases of Cell Cycle
Following similar steps, we can easily get the following trellis of boxplots: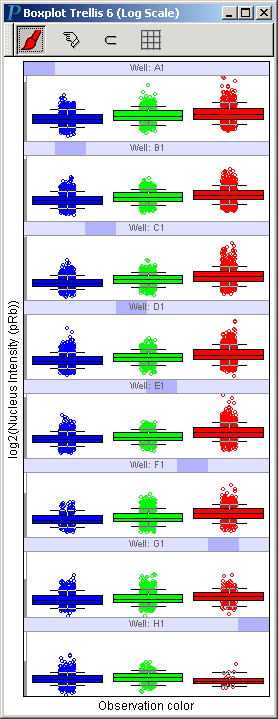
Note that the pattern in the H1 (subject to the highest camptothecin concentration) panel is distinctly different from those in other panels.