Activate Circle Antialiasing Globally
This operation is only available in the right-click menus of plots with glyphs representing individual observations (such as scatterplots, boxplots, Tukey sum-difference plots, ..., etc.) It toggles between 2 modes of drawing circles. Its effect is global and persistent across Argos sessions. What it does depends on if there is a ✓ mark to its left in a right-click menu.
- When there is no ✓ mark:
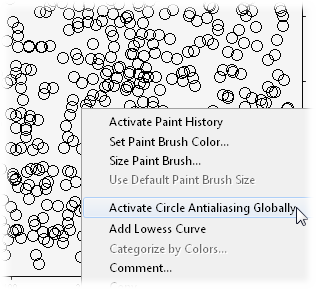
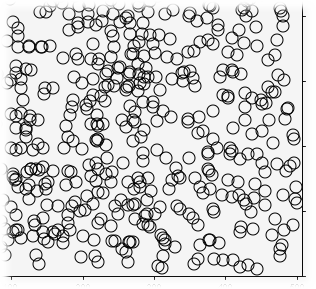
It makes Argos draw antialiased circles in plots with glyphs representing individual observations. For example, in Panel A, there is no ✓ mark to the left of this operation in the right click menu over a scatterplot displaying aliased circles. After invoking this operation, the scatterplot in Panel A will look like the one in Panel B.
- When there is a ✓ mark:
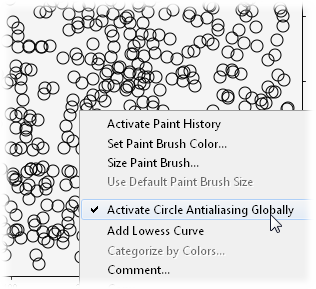
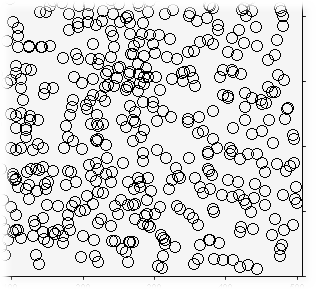
It makes Argos draw aliased circles in plots with glyphs representing individual observations. For example, in Panel C, there is a ✓ mark to the left of this operation in the right click menu over a scatterplot displaying antialiased circles. After invoking this operation, the scatterplot in Panel C will look like the one in Panel D.


