List X Tic Labels
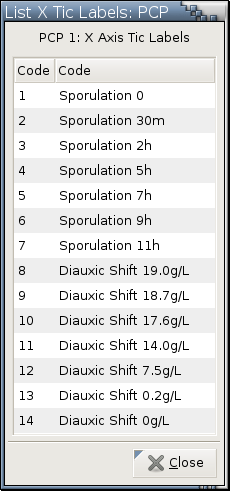
Parallel coordinate plots and boxplots generated by clicking a cluster in an SOM plot in SOM mode do not display variable names along the horizontal axis. To save space and avoid cluttering, integer numbers are assigned to these variables and are displayed along the horizontal axis. This operation pops up a list that shows the mapping between integer code and variables at a glance. Figure 13-9 is such an example.
Figure 13-9. A list showing the mapping between integer codes and variables.

---> images/hkf-list-x-tic-labels.png <---
As a reminder, moving the cursor close to a tic label on the horizontal axis will cause the name of the associated variable to pop up in a small window like:
