Animate Color Distribution...
The purpose of this operation is for you to relate the distribution of observation profiles of a specified color to the internal structure revealed by an x-rayed parallel coordinate plot.
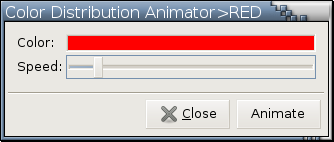
This operation is active and not grayed out in the right-click menu of a parallel coordinate plot if and only if the PCP contains observation profiles of 2 or more colors. It will first pop up a color palette for you to pick a color to animate. After a color is selected, a dialog like the one in Figure 13-6 will show up.
Press down the Animate button to start animation, which looks like Figure 13-7. Release the Animate button to stop the animation. When the cursor is over the color rectangle, the left mouse button can be clicked to select a different color to animate.