Categorize by Colors...
Painting is an important operation of Argos to explore data.
It is used to integrate information in different plots.
It can be used to specify the data you would like to retrieve
for further explorations.
There is a categorical variable, Observation color,
for you to treat the current coloring scheme
as a regular variable and you can use it wherever a
categorical variable can be used.
The coloring scheme in a plot is constantly changing
as you carry out painting operations to explore data.
If you would like to preserve a particular coloring scheme in a plot,
there are a couple of ways to accomplish it.
One way is, for each color in a plot,
to extract observations of the same color and
form a new data set with a meaning name.
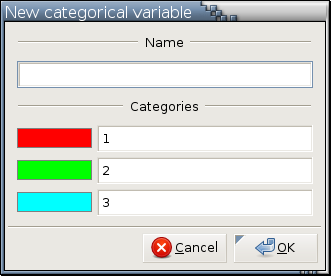
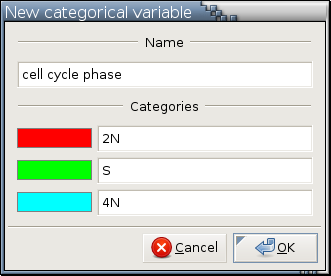
The other way is to use
Categorize by Colors...,
which allows you to define a new categorical variable
whose categories are determined by the coloring scheme in a plot
at the moment it is defined.
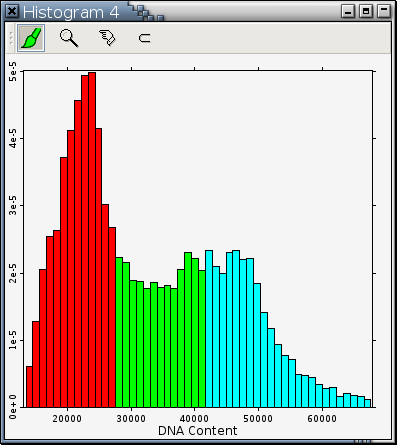
For example, Figure 13-8 is a DNA profile plot of 19,276 cells painted in 3 colors by a cell biologist to indicate 3 group of cells in different phases of cell cycle. Red cells are most likely in the 2N phase. green cells are most likely in the S phase. Cyan cells are most likely in the 4N phase.
Figure 13-8. A DNA profile plot of 19,276 cells
---> images;hkf-categorize-by-colors-dna-profile.png <---
Let D be a data set at the root level [1] in the scenegraph, P be a plot somewhere in the branch rooted at D, and Ds be the displayed data set in P. Data set Ds is a subset of data set D and may or may not contain the same set of observations. When Categorize by Colors... is invoked on plot P, only observations in data set Ds will take on one of the defined categories for the newly defined categorical variable; all observations in data set D but not in data set Ds will have the missing value code "NA" as their values.
When Shift-<Categorize by Colors...> [1] is invoked on plot P, the list of colors defining a new categorical variable is still determined by data set Ds but all observations in data set D will take on one of the defined categories for the new categorical variable. If the color of an observation in data set D is not one of the category-defining colors in Ds, the missing value code "NA" will be used as the value of the new categorical variable for this observation.
Categorize by Colors... will be active and not grayed out in the right-click menu of a plot if and only if there are 2 or more colors in the displayed data.