Right Click Menus
Each scenegraph node has a right-click menu. The contents of a right-click menu are determined by the type of the scenegraph node. All possible menu entries are described here:
- Categorize by Colors...
This is only available to collection nodes that have at least 2 different colors among their observations. It enables you to convert the current coloring scheme in a collection into a new categorical variable. See here for details.
- Comment...
This is only available to collection nodes for you to add comments to a data set. These comments will show up in the HTML document generated by Report in HTML... and Report All in HTML... . See here also.
- Hide All
This will make every viewport and dialog in the branch [1] disappear from the screen. The nodes representing those hidden viewports and dialogs will be grayed out and will not have
 icons to their left.
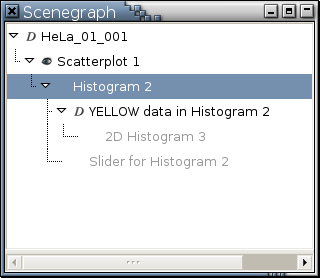
For example,
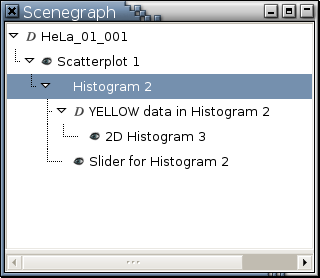
Figure 5-2
is a scenegraph snapshot after you invoke
Hide All on "Histogram 2".
Figure 5-2. After invoking Hide All on "Histogram 2"
---> images/scenegraph-hide-all-example.png <---
This menu entry will be active as long as the branch contains at least one viewport or dialog currently being shown on the screen.

You can invoke the right-click menu of a node that's been grayed out.
- Hide
This is similar to Hide All but only makes the object (a viewport or a dialog) represented by a node disappear from the screen. Any other viewports or dialogs in the branch will not be affected. For example, Figure 5-3 is a scenegraph snapshot after you invoke Hide on "Histogram 2". There is no
 icon to the left of "Histogram 2"
because it is iconified.
- Delete
If a viewport node or a dialog node is deleted, the corresponding window will be killed. If the deleted viewport node has a branch underneath it, all nodes in the branch will be deleted, too. If a collection node is deleted, the data it represents is removed from Argos. If the deleted collection node has a branch underneath it, all nodes in the branch are deleted as well.
If Ctrl-Delete is applied to a viewport node represents a page in a trellis display with 2 or more pages, a dialog will pop up to ask you if you would like to delete all other pages of this trellis display. [2]
- Rename...
This is only available to collection nodes and viewport nodes. When applied to a collection node, it renames the data set represented by the collection node. The name of a data set is case-sensitive and has to be unique. Argos will remind you if the specified name is not unique. When applied to a viewport node, it changes the name displayed in the title bar of the viewport. The name of a viewport is case-sensitive but is not required to be unique.
- Report in HTML...
This function generates an HTML document that contains 2 frames. The top frame is the summary panel that displays a branch of the scenegraph. The root of the branch is the node on which you invoke this function. The lower frame contains details distilled from those nodes in the branch in the summary panel. Details distilled from a viewport node are its PNG image and any comments entered via the Comment... command. Details distilled from a collection node are its name and comments. Details distilled from a nonmodal dialog are its name and the value(s) it is displaying or controlling. Clicking a node in the summary panel will cause its details to be displayed in the lower frame. This is an example HTML document generated by this function.
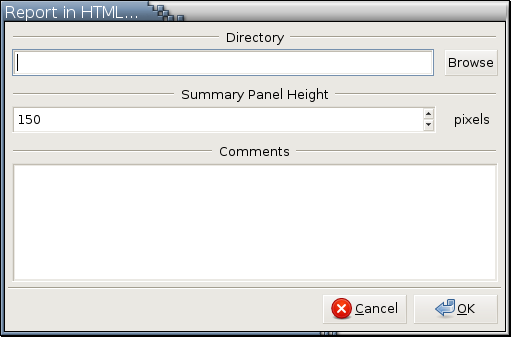
After invoking this function, a modal dialog like the following
will pop up. You specify the directory into which the generated HTML document and PNG images will be saved. To view the generated HTML document, aim a web browser at the file index.html in the specified directory. Any comments entered in this dialog will show up below the branch of nodes in the summary panel.- Report All in HTML...
This function is similar to Report in HTML... but generates an HTML document based on all the branches in the scenegraph.
- Summarize
This will pop up a dialog in which all variables in this data set are summarized. If the Shift key is pressed when Summarize is invoked, a menu will first pop up for you to select variables to be summarized. See here for details.
- Show All
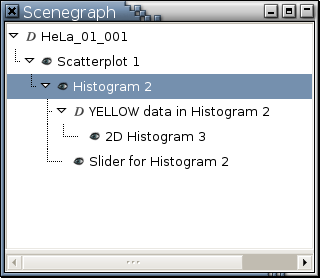
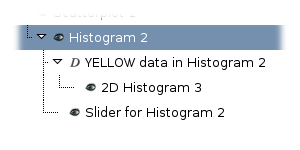
This does the opposite of what Hide All does. Figure 5-4 is a scenegraph snapshot after you invoke Show All on "Histogram 2". Please compare the color difference between Figure 5-2 and Figure 5-4.
- Show
This is similar to Show All and does the opposite of what Hide does.
