Summarize Boxplot Trellis
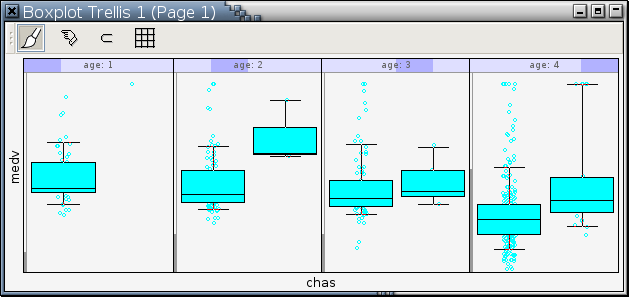
This operation will retrieve all the displayed data in a trellis display of boxplots and, for each boxplot in the trellis display, a brief summary will be presented. For example, invoking this operation on the following trellis display of boxplots:
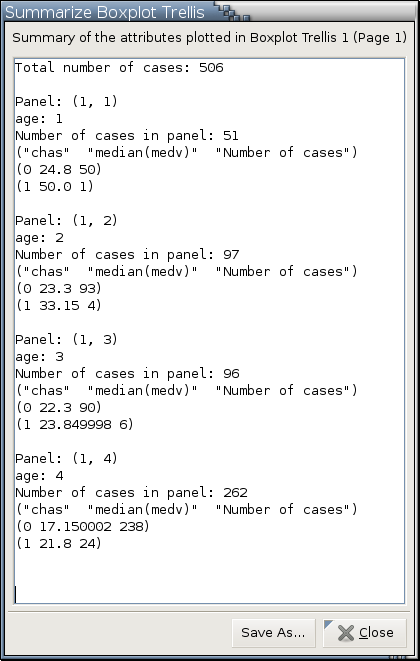
will generate the following: This dialog tells you that there are 51 cases in the left-most panel. Of the 51 cases, 50 cases have 0 as the value of the categorical variablechas. The median
medv value of the 50 cases is 24.8.
See here for details on the Save As... button.

