Boxplot Mode
Mode Icon:

Mode Cursor:

Mode Function: Show Percentiles
Supporting Functions:
A boxplot contains at least one box graph. For example, the boxplot in Figure 11-2 has 8 box graphs. This mode allows you to easily find out the 0th (minimum), 10th, 25th, 50th (median), 75th, 90th, and 100th (maximum) percentiles of the values of the observations in a box graph. Move the cursor over the box graph you are interested in and click. Or you can press and drag the left mouse button to make a selection. The selected box graph will be highlighted in gray as
A nonmodal dialog like Figure 9-12 will pop up as soon as the left mouse button is released.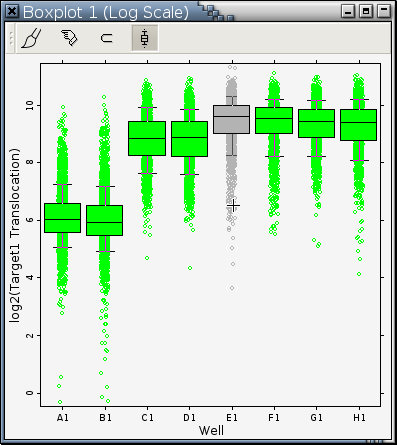
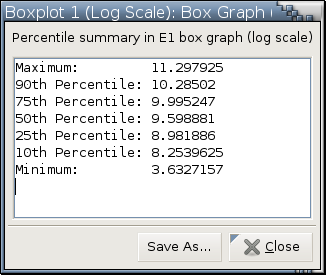
Figure 9-12. A dialog showing 7 percentile statistics of a box graph
---> images/boxplot-mode-show-percentiles.png <---
Percentile summary in E1 box graph (log scale)

Maximum:         11.297925
90th Percentile: 10.28502
75th Percentile: 9.995247
50th Percentile: 9.598881
25th Percentile: 8.981886
10th Percentile: 8.2539625
Minimum:         3.6327157

Saved at 2010-04-23 00:07:01Z

------------------------------------------------------------

Percentile summary in E1 box graph (log scale)

Maximum:         11.297925
90th Percentile: 10.28502
75th Percentile: 9.995247
50th Percentile: 9.598881
25th Percentile: 8.981886
10th Percentile: 8.2539625
Minimum:         3.6327157

Saved at 2010-04-23 00:07:12Z
|
Supporting Functions
- Trim (5 5)
This function sorts observations in each box graph according to their Y values and trims off 5 observations with the smallest Y values and 5 observations with the largest Y values from each box graph. It then pools the remaining observations from each box graph to draw a boxplot, using the same X and Y variables as the original boxplot. This function is only active and not grayed out in the right-click menu when all box graphs in a boxplot have 20 or more observations each.

All these trimming functions are not available to the boxplot resulting from left clicking a cluster in a self-organizing map.
- Trim (10 10)
Same as Trim (5 5) but with 10 observations trimmed off each end of all box graphs. This function is only active and not grayed out in the right-click menu when all box graphs in a boxplot have 40 or more observations each.
- Trim (15 15)
Same as Trim (5 5) but with 15 observations trimmed off each end of all box graphs. This function is only active and not grayed out in the right-click menu when all box graphs in a boxplot have 60 or more observations each.
- Trim (1% 1%)
This function sorts the observations in each box graph according to their Y values and trims off 1% of them with the smallest Y values and 1% of them with the largest Y values from each box graph. It then pools the remaining observations from each box graph to draw a boxplot, using the same X and Y variables as the original boxplot. This function is only active and not grayed out in the right-click menu when all box graphs in a boxplot have 100 or more observations each.
- Trim (5% 5%)
Same as Trim (1% 1%) but with 5% of the observations in each box graph trimmed off both ends. This function is only active and not grayed out in the right-click menu when all box graphs in a boxplot have 20 or more observations each.
- Trim (10% 10%)
Same as Trim (1% 1%) but with 10% of the observations in each box graph trimmed off both ends. This function is only active and not grayed out in the right-click menu when all box graphs in a boxplot have 10 or more observations each.