Summarize Data
This operation will retrieve all the displayed data in a viewport and pop up a dialog in which all the variables that are used to generate the viewport are summarized, based on the retrieved data. For example, if this operation is invoked over a histogram, only 1 variable will be summarized. If this operation is invoked over a plot of a regression tree grown with 10 carriers and 1 independent variable, 11 variables will be summarized.
If the Shift key is pressed when this operation is invoked, a menu listing all the variables in the retrieved data will pop up for you to select variables to summarize and to determine the order in which they are summarized. An example of such a menu is the following:
See here for details on how to use this menu.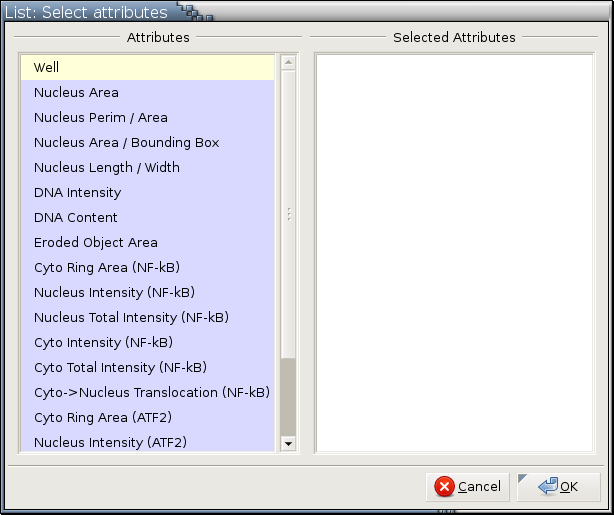
Here are a few examples:
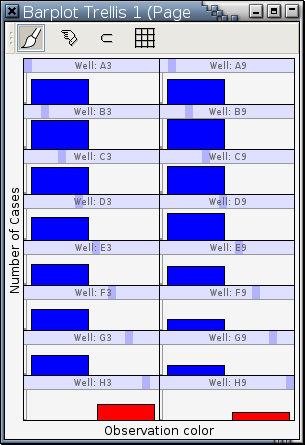
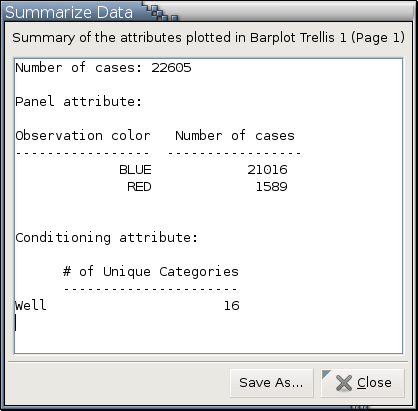
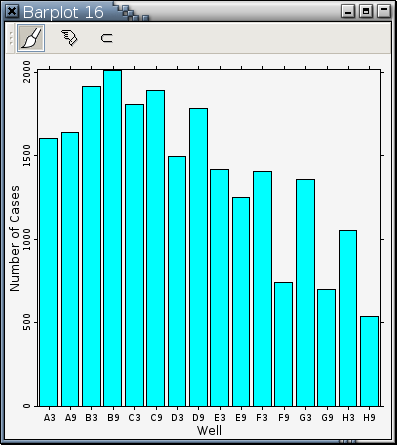
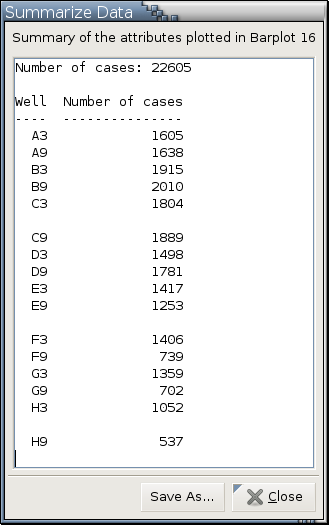
There are 2 variables in the trellis display of barplots: "Observation color" and "Well". The right panel is the corresponding data summary.

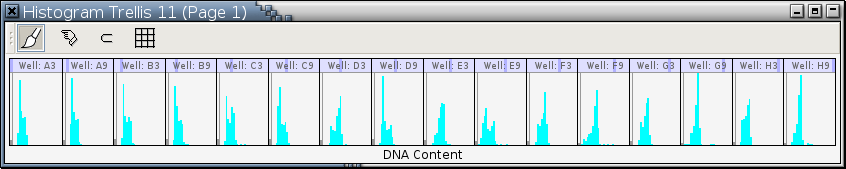
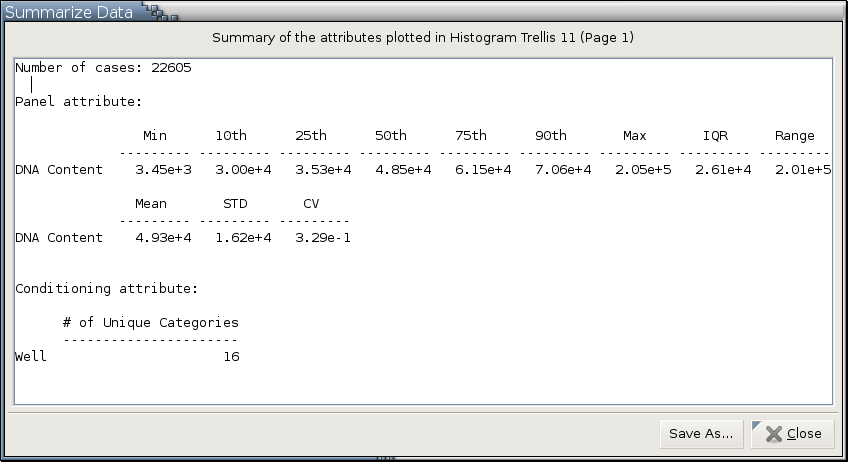
---> images/hkf-summarize-data-example-1a.png <--- ---> images/hkf-summarize-data-example-1b.png <--- There are 2 variables in the trellis display of histograms: "DNA Content" and "Well". The lower panel is the corresponding data summary.
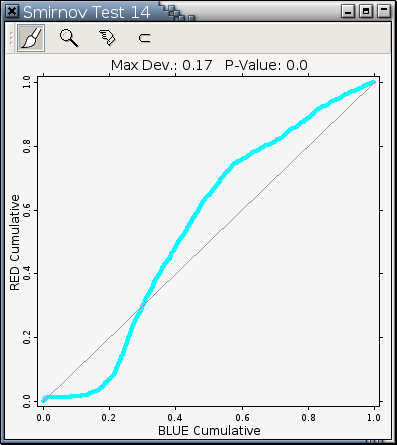
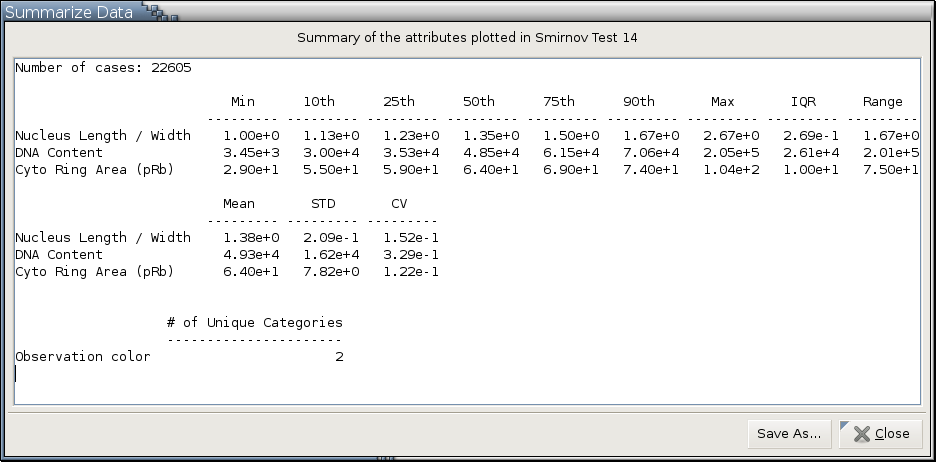
IQR stands for interquartile range, which is the difference between the third quartile and the first quartile. The third quartile is the 75th percentile, which is denoted as 75th in the above panel. The first quartile is the 25th percentile, which is denoted as 25th in the above panel. 50th in the above panel is the median.---> images/hkf-summarize-data-example-2a.png <--- ---> images/hkf-summarize-data-example-2b.png <--- Here is the output of a Smirnov test with "Observation color" as the group variable and 3 test variables:
This is the corresponding data summary:The left panel is a plot of 1 categorical variable. The right panel is the corresponding data summary.
---> images/hkf-summarize-data-example-4a.png <--- ---> images/hkf-summarize-data-example-4b.png <---