Nodes
The scenegraph is a directional acyclic graph. It contains many nodes. Each node has a right-click menu, whose entries depend on the type of the node. Figure 5-1 is a scenegraph snapshot.
Nodes in Figure 5-1 can be divided into 2 categories with the deciding factor if there is a triangle to their left: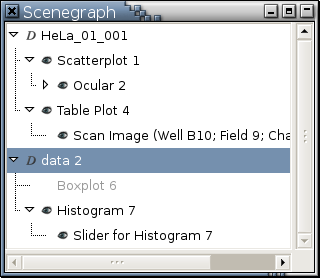
No triangle to the left: This is a leaf node.
A triangle to the left: This is a branch node. The state of a branch node is indicated by the orientation of the triangle to its left:
 means this branch node is collapsed
and you can click the circle to expand it.
means this branch node is collapsed
and you can click the circle to expand it.
 indicates this branch node is expanded and
you can click the circle to collapse it
indicates this branch node is expanded and
you can click the circle to collapse it
Alternatively, nodes in the scenegraph can be divided into 3 main categories according to what type of objects they represent: collections (data sets), viewports (plots), and dialogs.
Collection nodes. Each collection node has a
 icon to its left.
Available right-click menu entries are:
Categorize by Colors...
,
Comment...
,
Delete
,
Hide All
,
Show All
,
Rename...
,
Report in HTML...
,
Report All in HTML...
, and
Summarize
.
icon to its left.
Available right-click menu entries are:
Categorize by Colors...
,
Comment...
,
Delete
,
Hide All
,
Show All
,
Rename...
,
Report in HTML...
,
Report All in HTML...
, and
Summarize
.
Viewport nodes, representing plots generated by Argos's visualization tools and analytical tools. A
 icon to the left of a viewport node means
the plot it represents is not iconified.
An iconified plot, such as "Boxplot 6"
in Figure 5-1, does not have this eye icon
and its name is printed in light gray.
Available right-click menu entries are:
Delete
,
Hide
,
Show
,
Hide All
,
Show All
,
Rename...
,
Report in HTML...
, and
Report All in HTML...
.
icon to the left of a viewport node means
the plot it represents is not iconified.
An iconified plot, such as "Boxplot 6"
in Figure 5-1, does not have this eye icon
and its name is printed in light gray.
Available right-click menu entries are:
Delete
,
Hide
,
Show
,
Hide All
,
Show All
,
Rename...
,
Report in HTML...
, and
Report All in HTML...
.
Dialog nodes, representing non-modal dialogs. A
icon to the left of a dialog node means
the dialog it represents is not iconified.
Available right-click menu entries are:
Delete
,
Hide
,
Show
,
Report in HTML...
, and
Report All in HTML...
.
Additionally,
Hide All
and
Show All
will be in the right-click menu of a
dialog node if data can be retrieved from
the non-modal dialog it is representing.
For example,
a dialog node representing the dialog
resulting from invoking
Find Similar
in a parallel coordinate plot
will have these 2 menu items.
Left clicking a non-hidden, non-collection node in the scenegraph will make the corresponding window rise to the top. Making the window of a plot, a list view, or a non-modal dialog the focused window (for example, clicking its title bar) will highlight the corresponding node in the scenegraph.