Parallel Coordinate Plot Mode
Mode Icon:

Mode Cursor:

Mode Function: Find Similar
Supporting Functions:
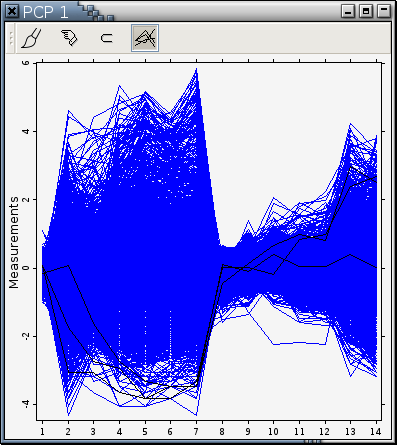
The PCP mode function allows you to press the left mouse
button and drag the
cursor around to select observation profiles.
While the
cursor is being dragged around,
pointed observation profiles are highlighted in black,
as illustrated in
Figure 9-13.
Figure 9-13. Right before the left mouse button is released
---> images/pcp-mode-left-button-pressed.png <---
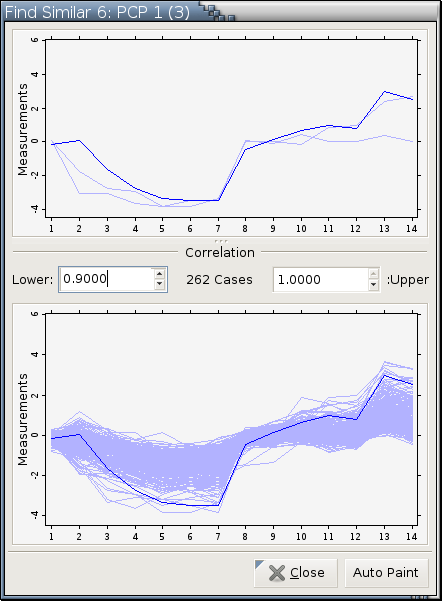
The top (or seed) panel contains all the selected seed profiles. One of the seed profiles is used to specify similar profiles in the bottom (or result) panel and it is called the current seed profile.
The current seed profile is drawn twice in its original color; once in the seed panel and once in the result panel.
All observation profiles other than the current seed profile are drawn in less saturated colors of the same hue as their original colors.
Click the left mouse button while the cursor is over a seed profile to make it current.
The result panel always keeps what it displays in sync with the current seed profile and the specified correlation coefficient interval.
Specify a correlation coefficient interval in the middle panel. An observation profile whose correlation coefficient with the current seed profile is within this interval will be displayed in the result panel. The number of all such observations is printed in the middle of the middle panel.
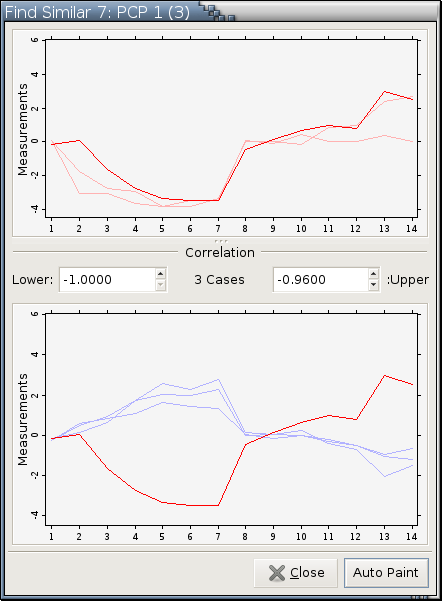
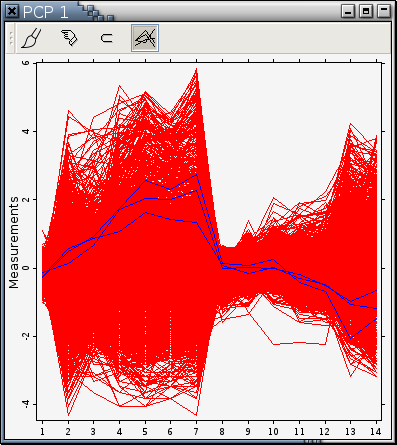
The Auto Paint button paints all observations either blue or red. An observation is painted blue if the correlation coefficient between its profile and the seed profile is within the specified interval; otherwise, it's painted red. For example, changing the lower bound to -1.0 and the upper bound to -0.96 in Figure 9-14 and clicking its Auto Paint button will produce the following left panel. Notice that the seed line in the result panel is red because its correlation coefficient with itself is 1.0, which is not in the specified interval. The right panel is what the original PCP will look like after the auto-painting operation. If there are other plots based on this data set, they will be redrawn to display the latest observation colors [1].

---> images/pcp-mode-find-similar-auto-painted.png <--- ---> images/pcp-mode-find-similar-auto-painted-pcp.png <--- A right-click menu is available in the seed panel with the following operations:
Identify... : The hand cursor is always black and profiles pointed by the hand cursor are highlighted in black.
A right-click menu is available in the result panel with the following operations:
The cursor in the result panel is
 , which means you can click on profiles to
identify
observations represented by those profiles.
, which means you can click on profiles to
identify
observations represented by those profiles.
Supporting Functions
- Color Find Similar...
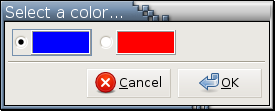
This function is very similar to Find Similar. Instead of pressing and dragging a mouse cursor to select a seed profile, it allows you to select profiles of a certain color as seeds. Using the PCP in the above right panel as an example, invoking this function will first pop up a color selector like the following:
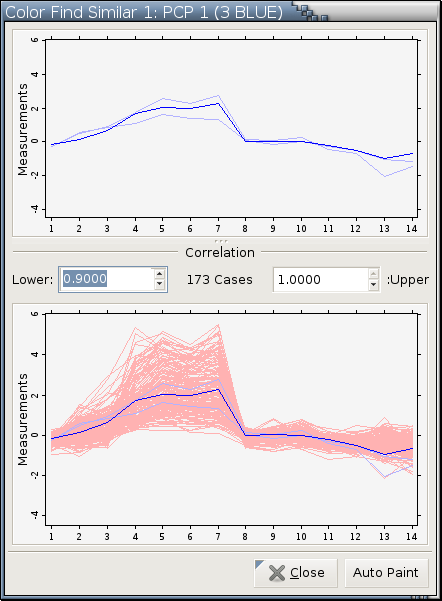
Pick the blue color and click the OK button to get a Color Find Similar dialog (Figure 9-15). Color Find Similar dialogs have the same properties as Find Similar dialogs.This function is not active and is grayed out in a right-click menu when all profiles in a PCP are of the same color.
- Find Similar in Ranges...
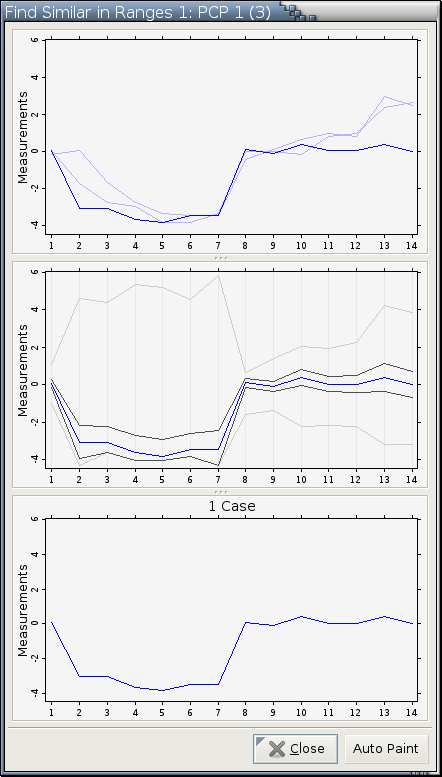
This operation allows you to pick a few seed profiles with a cursor. One of the seed profiles is chosen as the current seed profile. The current seed profile is used as a guideline to construct an envelope. Only observation profiles within the specified envelope are displayed.
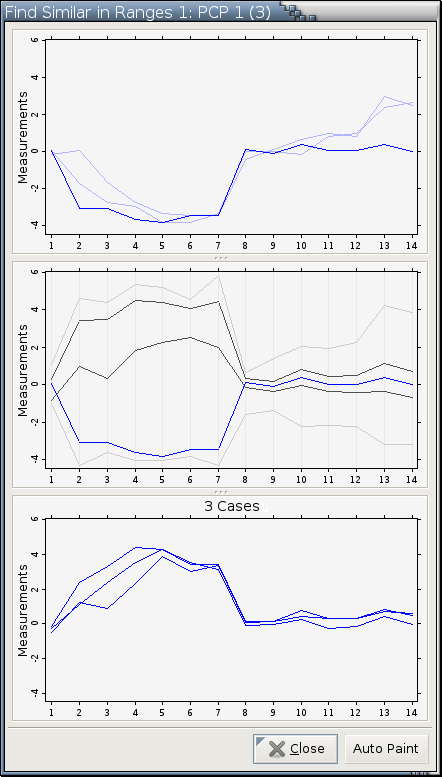
Use Figure 9-13 and the 3 observation profiles highlighted in black to illustrate this operation. The dialog generated by this operation with the 3 selected seed profiles is the left panel of Figure 9-16. The right panel is a snapshot of the left panel after the black envelope being adjusted.
The top (or seed) panel displays seed profiles. The middle (or envelope) panel is for adjusting the black envelope. The bottom (or result) panel displays those observation profiles within the specified black envelope.---> images/pcp-mode-find-similar-in-ranges-initial.png <--- ---> images/pcp-mode-find-similar-in-ranges-final.png <--- Properties of Find Similar in Ranges dialogs are:
The seed panel:
One of the seed profiles is used as a guideline in the envelope panel to specify an envelope and it is called the current seed profile.
The current seed profile is drawn in its original color. All other seed profiles are drawn in less saturated colors of the same hue as their original colors.
Click the left mouse button while the cursor is over a seed profile to make it current.
Its right-click menu supports the following operations:
Identify... : The hand cursor is always black and profiles pointed by the hand cursor are highlighted in black.
The envelope panel:
The current seed profile is drawn in its original color to provide a guideline for specifying an envelope.
There are 2 envelopes. One consists of 2 connected gray line segments; the other consists of 2 connected black line segments. The gray envelope goes through the minimum and the maximum data values at each axis. The black envelope is adjustable by you and and can be positioned anywhere inside of the gray envelope.
When the cursor,
,
is close to a knot on the black envelope,
a red circle centered at the knot will be drawn:
When a red circle is drawn around a knot on the black envelope, you can press the left mouse button and drag it up and down to adjust the black envelope, as illustrated by this image:
Notice that the cursor switches from
to
 while the black envelope is being adjusted,
Its right-click menu supports the following operations:
Make the black envelope cover the central 10% of the data range at each axis.
Make the black envelope cover the central 20% of the data range at each axis.
Make the black envelope cover the central 30% of the data range at each axis.
Make the black envelope cover the central 40% of the data range at each axis.
Make the black envelope cover the central 50% of the data range at each axis.
The action of this menu item depends on if there is a ✓ mark to its left in the right-click menu. If there is no ✓ mark, selecting this menu item will case the result panel to update its content in real time while the black envelope is being adjusted. Instantaneous updating the result panel is the default behaviour on all UNIX-based systems. If this function is invoked when a ✓ mark is to its left, the result panel will not update its content while the black envelope is being adjusted; its content will only be updated after the left mouse button is released. Updating the result panel after the left mouse button is released is the default behaviour on Microsoft Windows systems.
The result panel:
The result panel always keeps what it displays in sync with the black envelope.
The current seed profile is drawn in the result panel if and only if it is within the black envelope.
All observation profiles are drawn in their original colors.
Its right-click menu supports the following operations:
The cursor in the result panel is
, which means you can click on profiles to
identify
observations represented by those profiles.
The Auto Paint button paints all observations [1] either blue or red. An observation is painted blue if it is within the black envelope; otherwise, it's painted red.
- Find in Ranges...
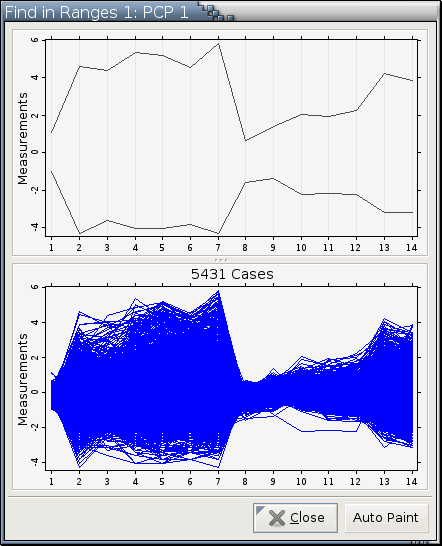
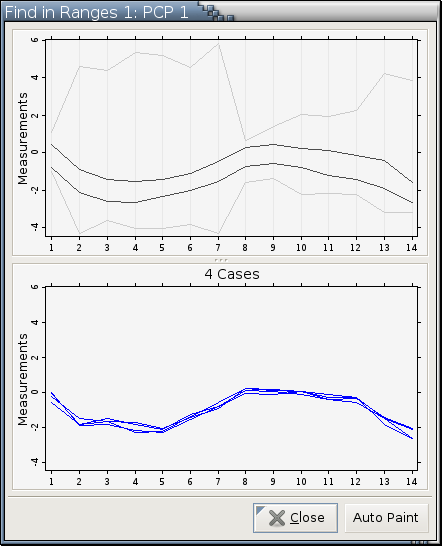
This operation does not select any seed profiles. It constructs an envelope that includes all observation profiles. You then proceed to adjust this envelope to trawl through the data for interesting profiles.
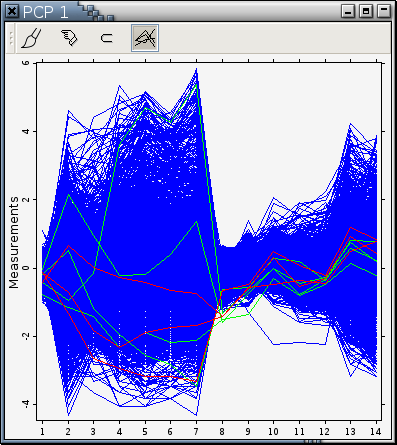
Use the data in Figure 9-13, which contains only blue observations [1], to illustrate this operation. The left panel of Figure 9-17 is a snapshot of the Find in Ranges dialog right after it was popped up; the right panel is a snapshot of the same dialog after the envelope was adjusted.
Except for the lack of a seed panel, a Find in Ranges dialog has the same properties as a Find Similar in Ranges dialog.---> images/pcp-mode-find-in-ranges-initial.png <--- ---> images/pcp-mode-find-in-ranges-final.png <--- - Show Stretched PCP
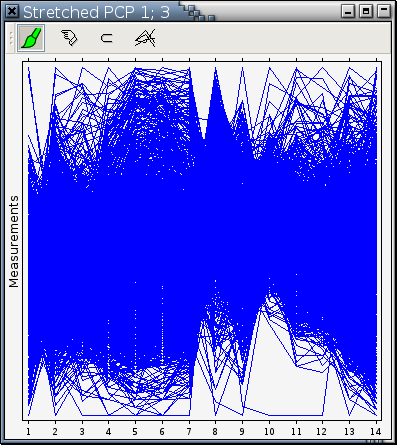
This operation draws a parallel coordinate plot in such a way that each axis uses a different scale so that the minimum and the maximum values of the variable at the axis are mapped to the bottom and the top of the available drawing room. Stretched parallel coordinate plots are good for detecting clusters visually. Figure 9-18 is a stretched parallel coordinate plot displaying the same data as Figure 9-13.
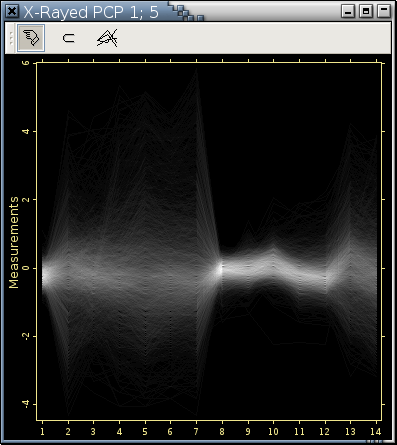
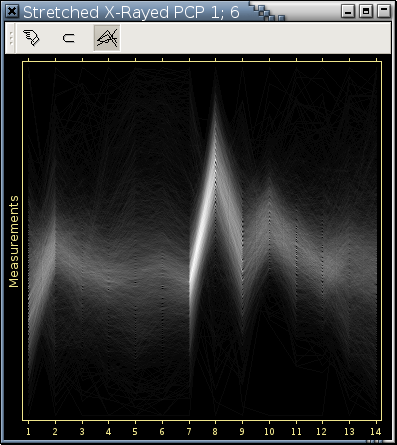
- Show Stretched X-Rayed PCP
This draws a stretched parallel coordinate plot in grayscale where the brightness of a pixel encodes the number of observation profiles passing through it. This drawing technique can reveal the internal structure obscured by overstriking. The right panel of Figure 9-19 is the x-rayed version of Figure 9-18.
Please see the next section for a list of properties and operations specific to x-rayed images.---> images/plot-pcp-x-rayed-example.png <--- ---> images/plot-pcp-stretched-x-rayed-example.png <--- - Show X-Rayed PCP
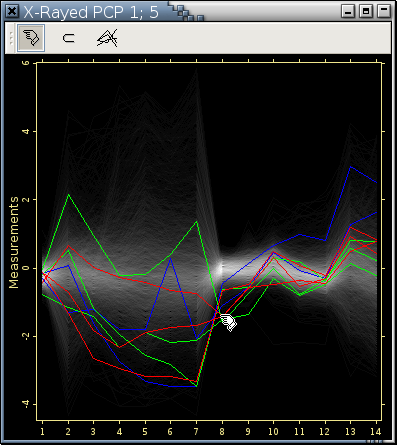
This draws a parallel coordinate plot in grayscale where the brightness of a pixel encodes the number of observation profiles passing through it. This drawing technique can reveal the internal structure obscured by overstriking. The left panel of Figure 9-19 is the x-rayed version of Figure 9-13.
There are a few properties and operations specific to x-rayed parallel coordinate plots:
When in
mode,
the pointed profiles will be highlighted in their
original colors.
For example, the following left panel is a PCP with
observations of 3 colors; the right panel illustrates
4 profiles being identified by the hand cursor.
---> images/pcp-with-3-colors.png <--- ---> images/pcp-with-3-colors-x-rayed-identified.png <--- Retrieve Data by Pointing... from the right-click menu of the
 mode also highlights pointed profiles
in their original colors.
mode also highlights pointed profiles
in their original colors.
Adjust Gamma... can make an x-rayed image brighter or darker.
Animate Color Distribution... in the right-click menu can help you visually correlate high density areas in an x-rayed image with observations of a specified color.