Abbreviate Categories...
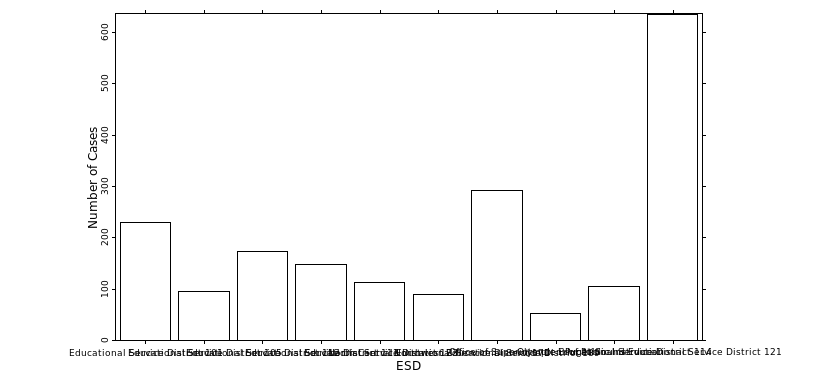
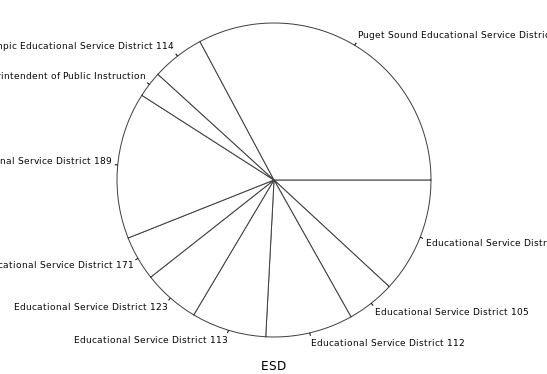
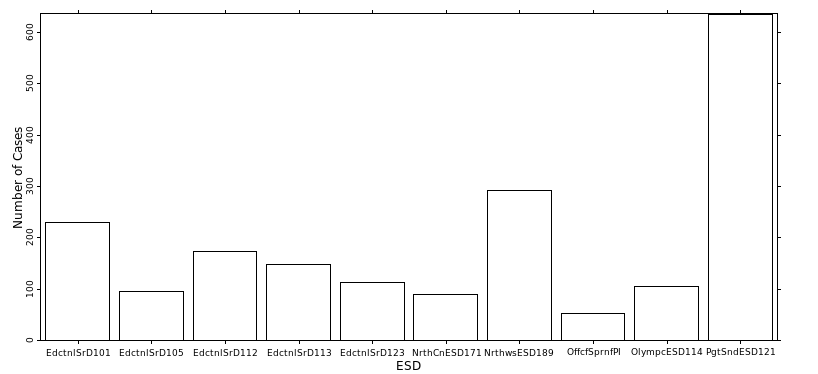
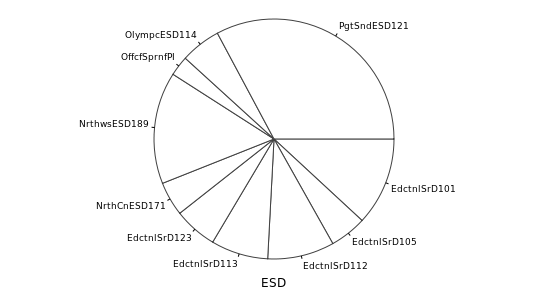
This operation is only available in the right-click menus of boxplots, barplots (not horizontal barplots), and pie charts. Tic labels of these 3 types of plots visualizing a categorical variable with long category names can either overlap with each others or be displayed partially, as illustrated by the barplot in Figure 13-1 and the pie chart in Figure 13-2
Figure 13-1. A barplot with long tic labels overlapping each others
---> images/hkf-barplot-long-cat-names.png <---
Figure 13-2. A pie chart with some long tic labels partially displayed
---> images/hkf-pie-chart-long-cat-names.png <---
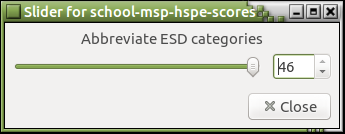
Figure 13-3. A dialog for abbreviating category names
---> images/hkf-abbreviate-cats-dialog.png <---
Figure 13-4. A barplot with abbreviated category names as tic labels
---> images/hkf-barplot-short-cat-names.png <---
Figure 13-5. A pie chart with abbreviated category names as tic labels
---> images/hkf-pie-chart-short-cat-names.png <---
We would like to emphasize it is the tic labels, within a plot, of a categorical variable with long category names that are affected by this operation. If we were to put the barplot in Figure 13-4 into the identify mode and left click its right-most bar, we would get the following [1]:
Notice that the full category names, "Puget Sound Educational Service District 121", are printed in the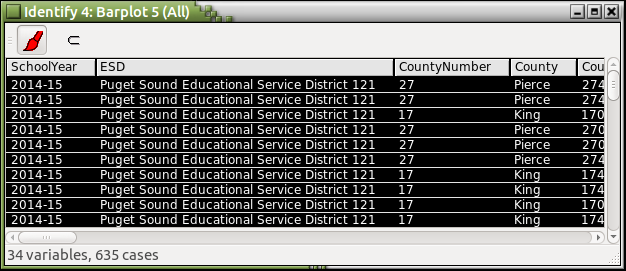
ESD column.