Set Axis Labels...
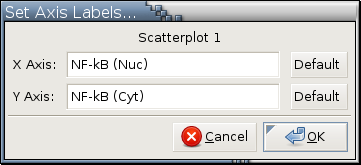
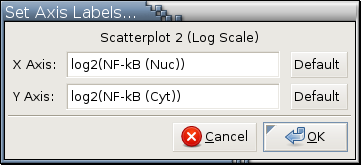
This function changes the the horizontal (X) axis labels and the vertical (Y) axis labels of a group of plots. The format of the dialog for this function depends on the number of plots in the group and if they all have the same scale (log or not). Here are examples to illustrate the many faces of this dialog.
- Dialogs in Panels A and B are for plots that satisfies the following 4 criteria:

---> images/hkf-set-axis-labels-1-original.png <--- ---> images/hkf-set-axis-labels-1-log.png <--- It is not an ocular from any zooming operation.
It is not generated by any Use Log Scale or Use Original Scale
It is not aimed at by any zoom lens.
It does not have any plots generated from it by invoking either Use Log Scale or Use Original Scale .
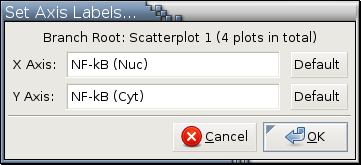
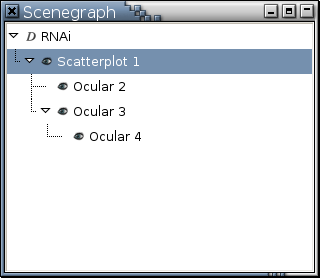
- The dialog in Panel C is for a group of plots that are related to each other through the zooming operation. Invoking Set Axis Labels... on any of the 4 plots listed in the scenegraph in Panel D will generate the dialog in Panel C.
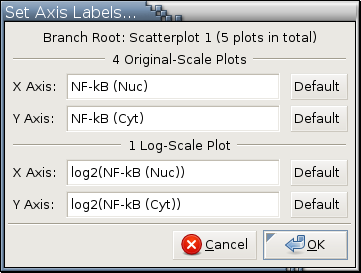
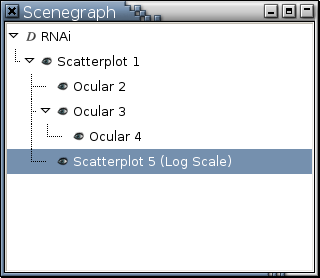
---> images/hkf-set-axis-labels-4-originals.png <--- ---> images/hkf-set-axis-labels-scenegraph-4-originals.png <--- - The dialog in Panel E is for a group of plots that are related to each other through the zooming operation, Use Log Scale , or Use Original Scale . Invoking Set Axis Labels... on any of the 5 plots listed in the scenegraph in Panel F will generate the dialog in Panel E.
---> images/hkf-set-axis-labels-mixed.png <--- ---> images/hkf-set-axis-labels-scenegraph-mixed.png <---