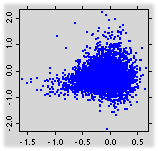
When the following plots are displaying data on the original scale:
this function will be in their right-click menus.
It generates a new plot of the same type as
the one on which it is invoked.
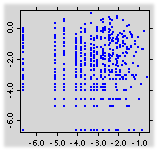
The positive data in the original plot are drawn on a log base 2 scale
in the new plot.
It is only active and not grayed out in a right-click menu
when the variable or variables being displayed have
positive values in a plot.
It is these positive values
that are going to be redrawn on a log base 2 scale.
The following sequence of figures demonstrates this point.
 | | ---> images/hkf-use-log-scale-seq-0.png <---
| | ---> images/hkf-use-log-scale-seq-1.png <---
| | ---> images/hkf-use-log-scale-seq-2.png <---
| | ---> images/hkf-use-log-scale-seq-3.png <---
|
|
Panel A is a scatterplot.
Applying
Use Log Scale to Panel A
to get the scatterplot in Panel B.
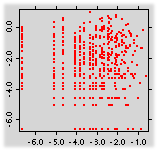
Making all data in Panel B red
to get Panel C.
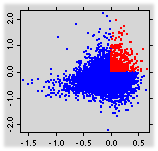
Now the scatterplot in Panel A
becomes the scatterplot in Panel D
with all first-quadrant points painted red.