Linear Regression Mode
Mode Icon:

Mode Cursor:

Mode Function: Show Linear Regression Summary
Supporting Functions:
This mode is only available to residual plots created by Linear Regression. .
The mode function, Show Linear Regression Summary, displays basic linear regression statistics in a pop-up window such as:
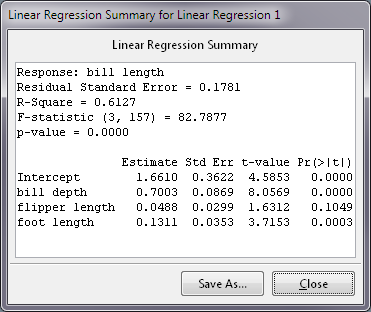
Supporting Functions
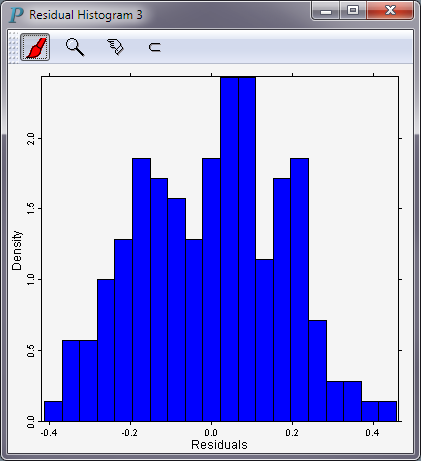
- Show Residual Histogram
This function generates a histogram of residuals such as
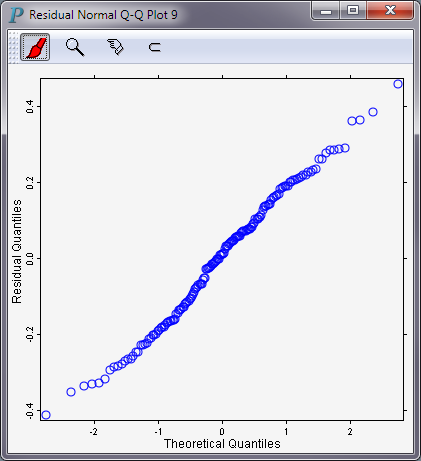
- Show Residual Normal Q-Q Plot
This produces a normal q-q plot of residuals such as
- Show Residual Plot...
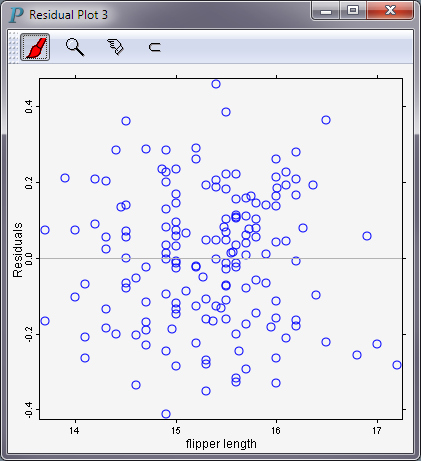
A residual plot is a scatterplot with residuals plotted on the vertical axis and another variable plotted on the horizontal axis. Variables eligible to be on the horizontal axis of a residual plot are the independent variables used in a linear regression run plus fitted values. The output of Linear Regression is itself a residual plot with fitted values on the horizontal axis (e.g., Figure 12-1.) When invoked by clicking the left mouse button, mode function Show Residual Plot... will first present you a menu containing all eligible independent variables. After an independent variable is selected, Show Residual Plot... proceeds to make a residual plot with the selected independent variable on the horizontal axis if such a residual plot does not already exist. If there is already such a residual plot, Show Residual Plot... will just raise it to the top so that it is not covered by any other plots.
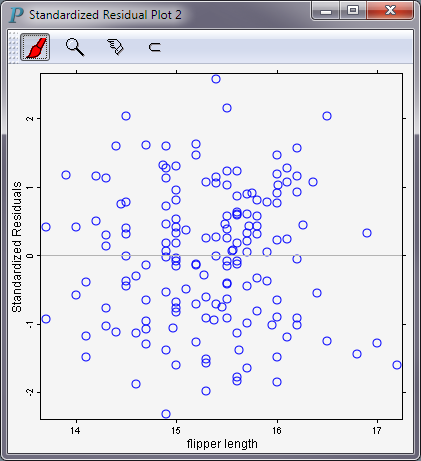
Another way to draw a residual plot is to plot the so-called standardized residuals on the vertical axis. Standardized residuals are residuals divided by the residual standard error, which is the square root of the residual mean square (or error mean square) and is displayed on the second line from the top in the output of Show Linear Regression Summary. Based one the linear regression assumptions, we might expect these standardized residuals to resemble a sample from a N(0, 1) distribution. To draw a standardized residual plot, hold down the Shift key when you click the left mouse button to to invoke Show Residual Plot.... This will pop up a menu whose first menu item is
Fitted Valuesand other menu items consists of the independent variables involved in the linear regression run. The following 2 residual plots have the same independent variable but the one in Panel B is a standardized residual plot.In a residual plot, outliers are points that lie far beyond the scatter of the remaining residuals, perhaps 4 or more standard errors from zero. A glance at the standardized residual plot in Panel B makes it clear there are about a handful of residuals beyond 2 standard errors from zero.
---> images/lsfit-mode-res-plot.png <--- ---> images/lsfit-mode-standardized-res-plot.png <---