Trellis Display Mode
Mode Icon:

Mode Cursor:

Mode Function: Zoom Into Panel
Supporting Functions:
The mode function can be invoked either
by clicking the left mouse button
while the
cursor is over a panel
or by pressing the left mouse button and
dragging the
cursor around to select a panel.
The graphics in the panel pointed to by the cursor
while the left mouse button is being held down will be drawn in gray.
After the left mouse button is released,
the graphics of the selected panel will be drawn
in a separate viewport, panel plot,
to give better resolution.
The horizontal and the vertical drawing ranges of panels plots
are the same as those of any panel of the trellis display
from which these panel plots are generated.
These 2 constraints allow you to easily compare panel plots
from the same trellis display and visually link panel plots
with their original panels in a trellis display.
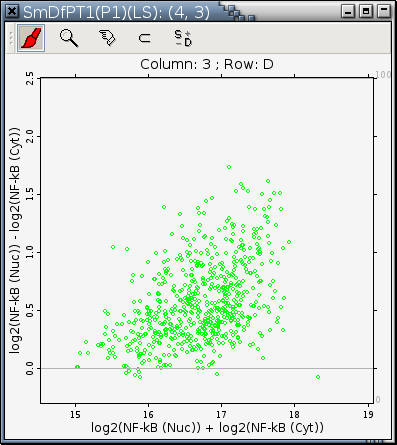
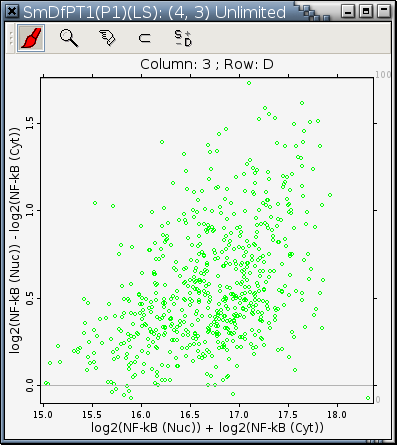
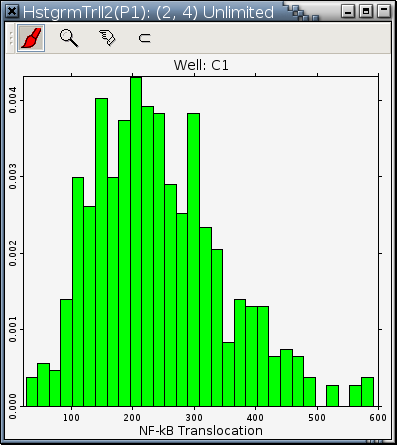
Examples of panel plots are:
| 
|
| (4, 3) panel of Figure 11-12 | (2, 4) panel of Figure 11-13 |
 |
|
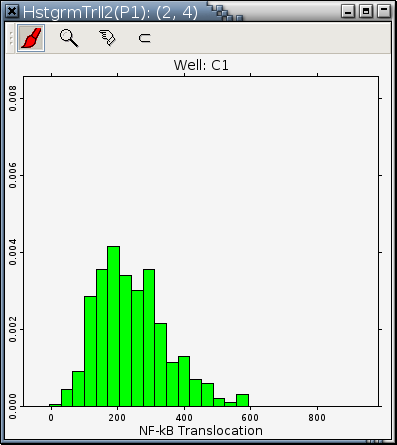
To get even better resolution than panel plots, you can hold down the Shift key when you release the left mouse button to get an unlimited panel plot. Unlimited panel plots draw their data with horizontal and vertical drawing ranges just barely big enough to encompass the graphics. Examples of unlimited panel plots are:
| 
|
| (4, 3) panel of Figure 11-12 | (2, 4) panel of Figure 11-13 |
|
|
Supporting Functions
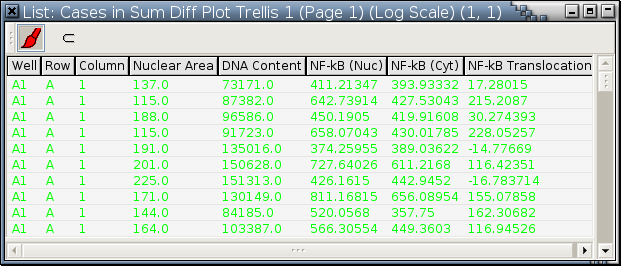
- List Cases in Panel...
After selecting this function from the right-click menu, the cursor will change from
You can carry out painting and data retrieval operations in this List View dialog..
to
 .
Move the cursor over the panel you are
interested in and click.
All the data in the selected panel will be put
into a List View dialog,
as illustrated by the following
.
Move the cursor over the panel you are
interested in and click.
All the data in the selected panel will be put
into a List View dialog,
as illustrated by the following
- Show Packet Size Bars
This function toggles between showing and hiding packet size bars, depending on if there is a ✓ mark to its left in a right-click menu.
When drawing space is not big enough, packet size bars will be automatically removed to make room for graphics and this function will be inactive and grayed out.- When there is no ✓ mark:
This only happens when a trellis display is not displaying any packet size bars. Invoke this function to display packet size bars. Figure 11-12 is an example of a trellis display with packet size bars.
- When there is a ✓ mark:
This only happens when a trellis display is already displaying packet size bars. This function removes all the packet size bars in a trellis display. For example, this is what Figure 11-12 looks like after packet size bars are removed:
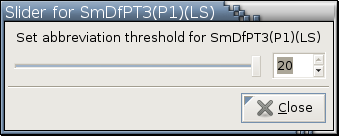
- Set Abbreviation Threshold...
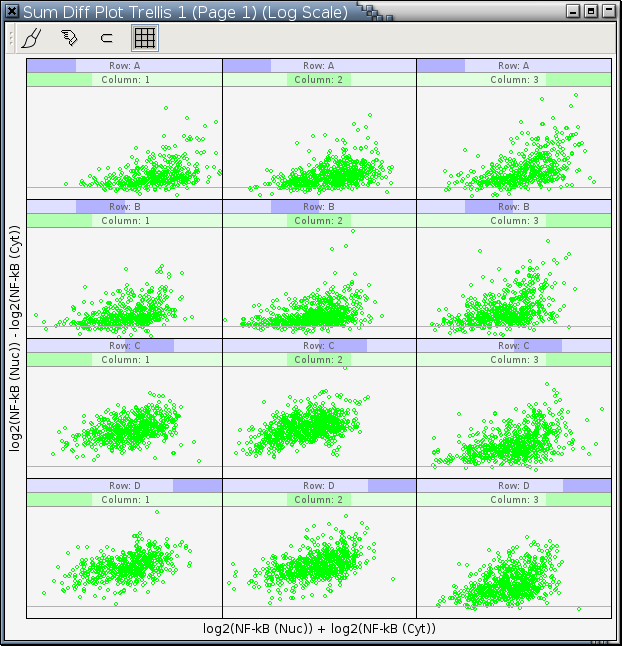
This function allows you to specify a threshold so that names of conditioning variables longer than the specified value will be abbreviated in strip labels. Figure 9-20 is an example to illustrate this function.
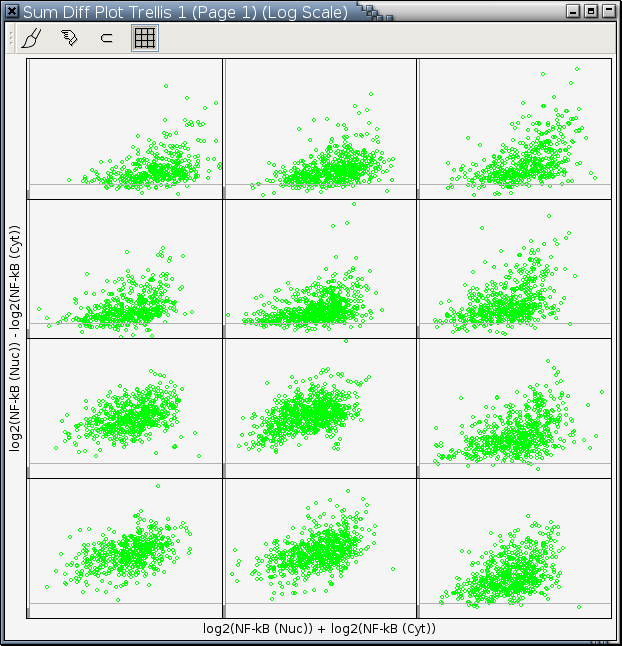
See the Section called Trellis Display in Chapter 11 for descriptions of the variables plotted on the horizontal and the vertical axes. The conditioning variable is DNA Content. Invoking this function on the trellis display in Figure 9-20 will pop up a slider like the following: To use no abbreviation at all, drag the knob in the slider to the right end. To use the maximum of abbreviation, drag the knob to the left end. Note that the number of characters in the abbreviated names of the conditioning variables may be greater than the specified threshold. This is becauseFigure 9-20. A trellis display of sum-difference plots with 12 equal-count conditioning intervals
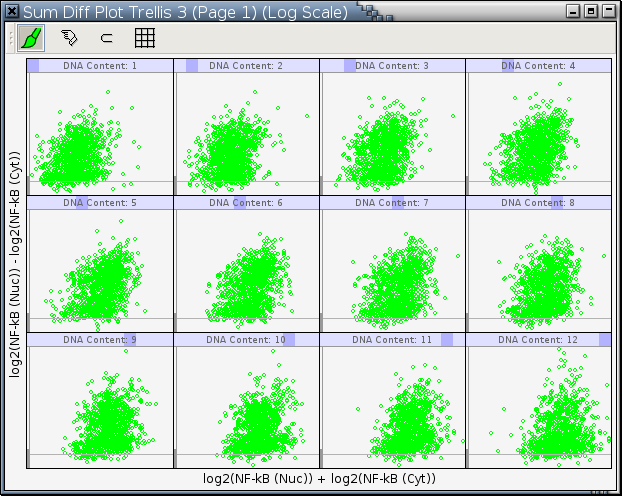
--->images/trellis-mode-sum-diff-example.png<---
If a variable name contains more than one word (words are separated by space), at least one letter from each word will be retained.
Argos may have to increase the number of characters in abbreviated names so that each conditioning variable can be uniquely identified by its abbreviation.
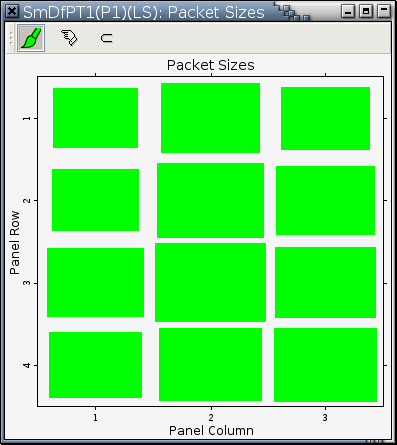
- Show Packet Sizes
This presents the number of observations in packets in a table plot. Each rectangle represents a packet and the rectangle area encodes the number of observations in that packet. For example, the output of this function applied to Figure 11-12 is
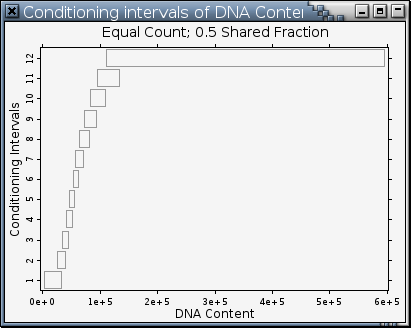
- Show Conditioning Intervals...
If a trellis display has only one numerical conditioning variable, this function presents its conditioning intervals graphically. For example, invoking this function on Figure 9-20 generates the following plot:
If a trellis display has more than one numerical conditioning variable, this function will first pop up a menu for you to pick a numerical conditioning variable before it can proceed to do the graphics. If a trellis display has no numerical conditioning variables, this function will be inactive and grayed out in its right-click menu.- Show Strips
To show or not to show strip labels in a trellis display is toggled by this function.
If a trellis display is already showing strip labels, there will be a ✓ mark to the left of this function in a right-click menu. Invoking this function under such circumstances will remove all strip labels in a trellis display. For example, this is what Figure 11-12 looks like after strip labels are removed:
If a trellis display does not show any strip labels, there will be no ✓ mark to the left of this function in a right-click menu. Invoking this function will cause a trellis display to show strip labels.If drawing space is not big enough for strip labels, this function will be inactive and grayed out