Linear Regression
Arguments: Numerical variables
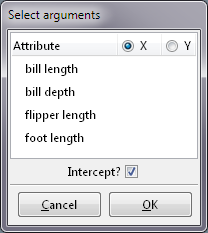
Argument menu:
Example:
This menu allows multiple variables to be selected as X variables (independent variables or carriers) but only allows one variable to be selected as Y variable (dependent or response variable).
When selecting X variables, use Left , Ctrl-Left , and Shift-Left . See here for details.
Housekeeping functions:
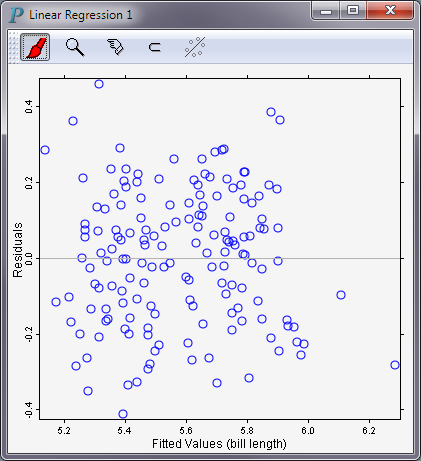
Example: Figure 12-1
The output of a linear regression run is presented as a residual plot, which is a scatterplot of fitted-values versus residuals.
Let
represent a set of n measurements of p independent variables and 1 dependent variable. We define the general linear regression model simply in terms of the p X variables: where| β0, β1, ..., βp are parameters | |
| Xi1, Xi2, ..., Xip are the i-th measurements of the p independent variables | |
| εi are independent N(0, σ2) | |
| i = 1, ..., n |
Let b0, b1, ..., bp be the least squares estimates of β0, β1, ..., βp. The fitted values are
The residuals are
