Set Drawing Ranges Same as...
Patterns in different viewports can be compared most conveniently and effectively when the viewports are of the same size and the drawing ranges are the same, too. This function enables you to quickly set the drawing ranges of one plot to be the same as those of another plot.
This function is only available in the right-click menus of scatterplots and 2D histograms. It will be active (i.e., not grayed out in a right-click menu) only when 2 or more plots listed above are in the scenegraph. It will be inactive in the right-click menu of a plot being aimed at by a zoom lens. After you invoke this function, it will pop up a plot selection menu like Figure 13-11.
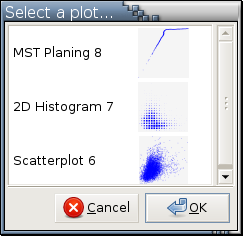
 | You can set the drawing ranges to be the same as those of a plot of a different type. For example, invoking this function in a scatterplot and getting the ranges from a Varebi plot. |
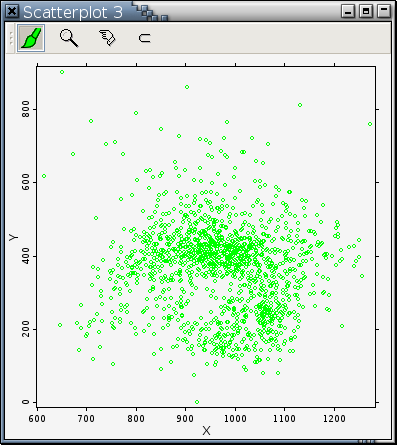
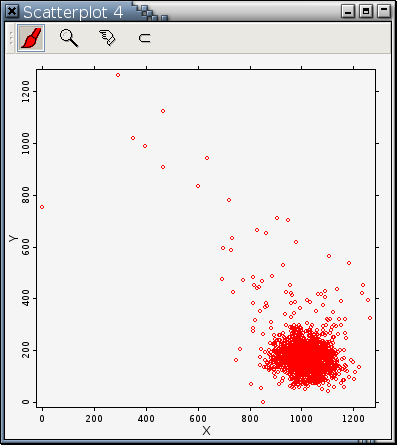
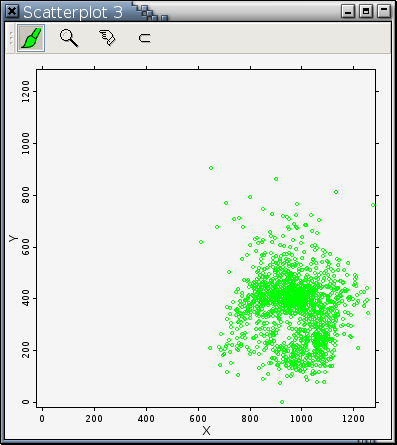
For example, to effectively compare the following 2 plots
|
|
|
|
This function is not in the right-click menu of any ocular resulted from a zooming operation.