Scatterplot
Arguments: Two numerical variables
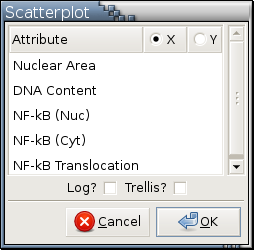
Argument menu:
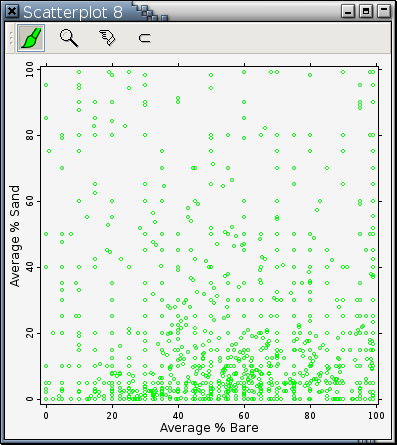
Example:
Only numerical variables are listed in this menu.
This argument menu allows the selection of 1 variable as the X variable to be plotted along the horizontal axis and 1 variable as the Y variable to be plotted along the vertical axis.
If Log? is checked, log2-transformed X and Y variables will be used to draw a scatterplot or scatterplot trellis display.
If Trellis? is checked, a scatterplot trellis display will be drawn.
Housekeeping functions:
Example: Figure 11-3
Each point icon in a scatterplot represents an observation object. The color, shape, and size of a point icon is determined by the observation object it's representing. A point icon can be painted, thereby changing the color property of the corresponding observation.

