Data Retrieval Mode
Mode Icon:
 [1]
[1]
Mode Cursor:

Mode Function: Retrieve Data of Color
Supporting Functions:
Retrieve Data by Pointing... Retrieve Data by Rubber Band... Retrieve Displayed Data Retrieve Cluster Data... [a] Retrieve Panel Data... [b] Notes:
a. Only available in SOM viewports
b. Only available in trellis graph viewports
In order to apply a function to a subset of the data in a viewport, you have to specify the subset first. This mode has 4 ways to specify a subset, all of which take advantage of existing patterns in the viewport.
No matter how a subset is specified, it will be put in a temporary collection and the primary console will turn into the temporary console to accommodate the temporary collection. In addition to almost all the functionalities in the primary console, the temporary console has a Make Permanent button. You can click this button to turn the temporary collection into a permanent collection. The newly created permanent collection will be registered in the scenegraph under the viewport where you initiate the data retrieval.
 | The temporary console is modal. |
Click the left mouse button, as suggested by the mode cursor
,
to invoke the mode function
Retrieve Data of Color
to create a subset of observations
of a specified color.
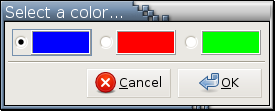
If this viewport contains more than one color,
a color palette
will pop up.
For example, this is a color palette from a viewport
that displays 3 colors:
What's describe above is about retrieving observations of the same color. If a viewport displays 2 or more colors, you can retrieve observations of different colors at the same time by holding down the Shift key when you press the left mouse button. For example, if you do so in a viewport displaying 3 colors, a color palette like the following will pop up:
This color palette allows one or more colors to be selected.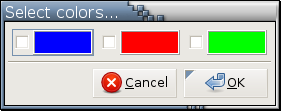
Supporting Functions
- Retrieve Data by Pointing...
This creates a subset based on the data in the clicked icon(s). After this function is invoked, the cursor will turn into
 .
You can either click or press and drag the left
mouse button to make your selection.
The selected icon(s) will be highlighted in gray.
You can abort by clicking the right mouse button
while the left mouse button is still being held down.
.
You can either click or press and drag the left
mouse button to make your selection.
The selected icon(s) will be highlighted in gray.
You can abort by clicking the right mouse button
while the left mouse button is still being held down.
- Retrieve Data by Rubber Band...
This creates a subset based on the observations that fall inside a rectangle that is pulled into shape in the same way as creating the target area of an objective lens: You move the cursor (
 on a Linux machine or
 on an MS Windows machine
if the viewport is based on 2 variables or
on an MS Windows machine
if the viewport is based on 2 variables or
 if the viewport is based on 1 variable)
to the place that will be one corner or one side of the
target area, press the left mouse button,
and drag the target area into shape.
You can abort by clicking the right mouse button
while the left mouse button is still being pressed.
if the viewport is based on 1 variable)
to the place that will be one corner or one side of the
target area, press the left mouse button,
and drag the target area into shape.
You can abort by clicking the right mouse button
while the left mouse button is still being pressed.
- Retrieve Displayed Data
Since a set is a subset of itself, you may specify the data in the a viewport as the target subset. This function retrieves all the data represented by all icons in a viewport.
- Retrieve Cluster Data...
This is only available in SOM viewports. It creates a subset based on all the data in an SOM cluster. After selecting this function from the right-click menu, the cursor will change into a northeast-pointing hand cursor. Move the cursor over the cluster you are interested in and click. Or you can press and drag the left mouse button to make your selection. All icons in the selected cluster will be highlighted in gray. You can abort by clicking the right mouse button while the left mouse button is still being held down.
- Retrieve Panel Data...
This is only available in trellis graph viewports. It creates a subset based on all the data in a panel. After selecting this function from the right-click menu, the cursor will change into a northeast-pointing hand cursor. Move the cursor over the panel you are interested in and click. Or you can press and drag the left mouse button to make your selection. All icons in the selected cluster will be highlighted in gray. You can abort by clicking the right mouse button while the left mouse button is still being held down.