Trellis Display
Trellis display is a framework for the visualization of data. Its most prominent aspect is an overall visual design, reminiscent of a garden trelliswork, in which panels are laid out into rows, columns, and pages. On each panel of the trellis, a subset of the data is graphed by a display method such as a scatterplot, 2D histogram, boxplot, table plot, histogram, barplot, Varebi plot, Tukey sum-difference plot, MST planing, or parallel coordinate plot. It provides a powerful mechanism for understanding interactions in studies of how a response depends on explanatory variables. With trellis display, the structure of data can be uncovered even when the structure is quite complicated.
Introduction
We'll use a subset of data from a high content screening (HCS) experiment to illustrate what trellis graphs look like and how they can be used. The goal of this HCS experiment is the quantitation of the functional consequence of gene knockdown of tumor necrosis factor receptor (TNF-R) by measuring the translocation of NF-κB into nuclei after tumor necrosis factor (TNF) treatment. Treatments applied to wells on a plate are:
Column 1 wells receive neither transfection reagent nor siRNA, Column 2 wells are treated with transfection reagent only, Column 3 wells are treated with transfection reagent and siRNA, Wells in Rows A and B are not treated with TNF, and Wells in Rows C and D are treated with TNF for 30 minutes.
In this particular experiment, the TNF-R's are knocked down by an siRNA specific to TNF-R's. The knockdown of TNF-R cannot be revealed by immunofluorescence staining because its expression level is too low. Instead, the response of one of the downstream effectors, NF-κB, is measured. 2 channels of fluorescence images of cells in these wells on a plate are obtained by an HCS reader. Channel 1 measures DNA stain for object (nucleus) identification. Channel 2 measures NF-κB stain for the estimation of its cytoplasm-to-nucleus translocation. There are 3 variables of interest from Channel 2:NF-κB resides in the cytoplasm in the resting state in most cells. When cells are stimulated with tumor necrosis factor (TNF), NF-κB moves from cytoplasm to nuclei.
TNF works by stimulating TNF receptor (TNF-R) on the cell surface. TNF-R then triggers many downstream events, among them is the activation of NF-κB. Once activated, NF-κB translocates into the nucleus.
NF-κB (Nuc) is the average NF-κB stain intensity in the nucleus.
NF-κB (Cyt) is the average NF-κB stain intensity in the cytoplasmic area around the nucleus. This cytoplasmic area is defined by the HCS reader used in the experiment and is only a subset of cytoplasm.
NF-κB Translocation is NF-κB (Nuc) minus NF-κB (Cyt).
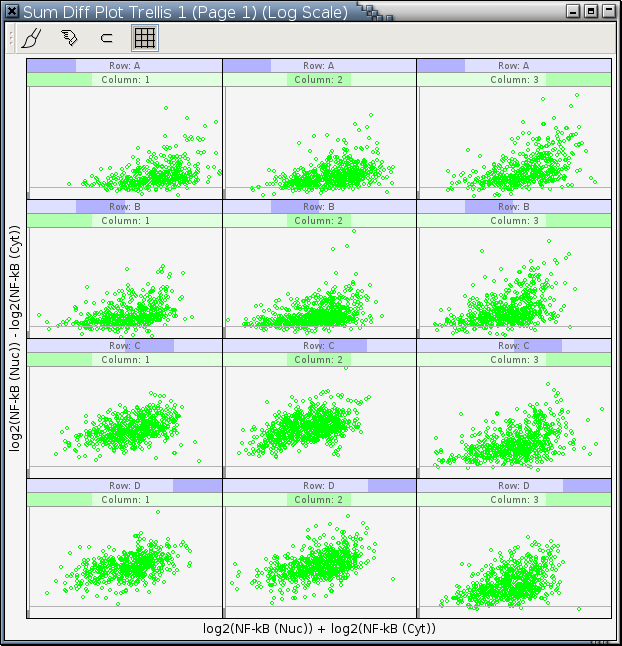
Figure 11-12 is a trellis graph of sum-difference plots in log2 scale with NF-κB (Cyt) as the X variable and NF-κB (Nuc) as the Y variable. It has 2 conditioning variables. The first one is Column, the column of a well on a plate, and the second one is Row, the row of a well on a plate. [1].
Figure 11-12. A trellis display of sum-difference plots
---> images/plot-trellis-sum-diff-example-0.png <---
First, let's interpret what we see in Figure 11-12:
For most cells, treated or untreated, their NF-κB (Nuc) values are greater than their NF-κB (Cyt) values.
Patterns in panels A1, A2, B1, and B2 are quite similar to each other.
Patterns in panels A3 and B3 are different from those in panels A1, A2, B1, and B2. Ideally, we would expect the patterns in these 6 panels to be the same because they are from cells not treated with TNF. This difference is probably due to some non-specific effect of the introduced siRNA and the fact that transfection of cells with siRNA is just like any other transfection, which could be quite traumatic to the cells.
Comparing the patterns in panels A1, A2, B1, and B2 with those in panels C1, C2, D1, and D2, it's clear that the point clouds in panels C1, C2, D1, and D2 move up quite a lot from the log2(R) = 0 line. This indicates that the translocation of NF-κB from cytoplasm to nuclei in non-transfected cells treated with TNF for 30 minutes is quite significant. It is also evident that the efficiency of gene knockdown with the siRNA used in this experiment is, as expected, not 100% because the point clouds in panels C3 and D3 also move up a bit but not as much as those in panels C1, C2, D1, and D2.
Figure 11-12 is a trellis display of 3 columns, 4 rows, and 1 page or a (3, 4, 1) trellis display for short.
Packet: The data in each panel is a packet.
Packet Size Bar: Each panel has an optional thin, vertical rectangle attached to its left edge. This rectangle is a packet size bar:
The percentage of a packet size bar filled with gray can be one of two things. It can be the percentage of the observations in the whole data set that fall in the packet of a panel. Or it can be equal to the ratio between the number of observations in a packet and the maximum number of observations in all packets. If it's the former, this is an absolute packet size bar. If it's the latter, this is a relative packet size bar. All packet size bars in a trellis display are either all absolute or all relative. When relative packet size bars are used in a trellis display, at least one of the panels has a packet size bar filled with gray from top to bottom. All panels of a trellis display act in unison to display or not to display packet size bars. When the drawing space is not big enough, packet size bars will be automatically removed to make room for graphics.Strip Label: The names of the conditioning variables and their levels are optionally printed in strip labels at the top of each panels. The strip labels for each variable have a dark bar that indicates the level of the variable:

---> images/plot-trellis-strip-cat-first-level.png <--- ---> images/plot-trellis-strip-cat-last-level.png <--- This conveys in a graphical way how the levels of the conditioning variables are changing over the trellis graph. If a trellis graph has 2 or more conditioning variables, the lowest strip label is for the first conditioning variable, the second lowest strip label is for the second conditioning variable, and so forth. All panels of a trellis graph act in unison to display or not to display strip labels. When the drawing space is not big enough, strip labels will be automatically removed to make room for graphics.---> images/plot-trellis-strip-euc-first-level.png <--- ---> images/plot-trellis-strip-euc-last-level.png <---
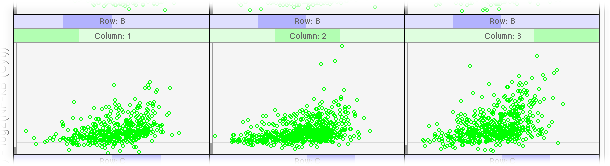
Figure 11-13 is a trellis graph of histograms of NF-κB Translocation, which is the cytoplasm-to-nucleus translocation of NF-κB. It has only 1 conditioning variable Well, which is a combination of the row and the column number of a well on a plate. The histogram in each panel is constructed for density estimation.
The ordering of the levels of the conditioning variable, Well, in Figure 11-13 is different from that in Figure 11-12, which uses one of the natural sequential ways to orders wells on a plate: A1, A2, A3, B1, ..., D2, and D3. The level ordering in Figure 11-13 is generated by main-effects ordering of category levels, which often allows us to perceive structure in the data that can not be seen easily without it. The level medians or means are a measure of the main effects. We have arranged that the levels of the variable Well are ordered based on level medians; the level median increases from left to right and from top to bottom. So the B2 well has the smallest median NF-κB Translocation and the D1 well has the largest. A glance at Figure 11-13 tells us the top panels are for those wells not treated with TNF and the bottom panels are for those wells treated with TNF. This implies the median NF-κB Translocation values of cells treated with TNF are higher than those of cells not treated with TNF. Of those wells treated with TNF, the C3 and D3 wells have smaller median NF-κB Translocation values than the rest and their histograms also look a bit different from those of the C1, C2, D1, and D2 wells. This means the introduced siRNA's are effective in knocking down TNF-R's but its effectiveness is not 100% as witnessed by their median NF-κB Translocation values bigger than those of the wells not treated with TNF. The histograms of the C3 and D3 wells are a bit different from those of the wells not treated with TNF, which also suggests not all TNF-R's are suppressed.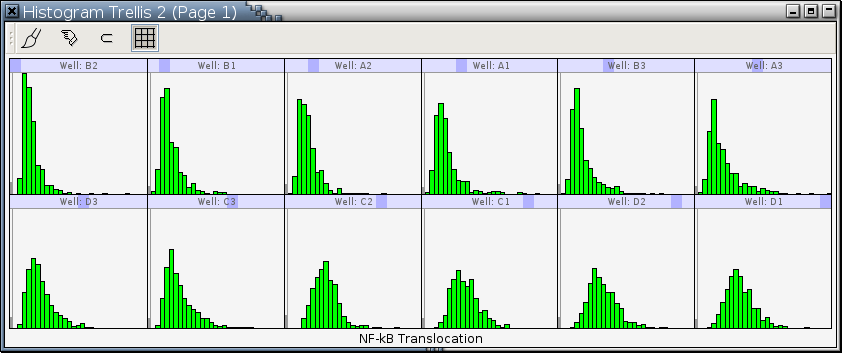
Makings of a Trellis Display
To produce a trellis display, you must specify the following information:
The trellis dimensions (columns, rows, and pages)
An order for the conditioning variables. For Figure 11-12, there are 2 conditioning variables, Col and Row. The order of the conditioning variables is (1) Col and (2) Row.
An order for the levels of each conditioning variable. For Figure 11-12, The order of the levels of the first conditioning variable, Col, is (1) 1, (2) 2, and (3) 3 and the order of the levels of the second conditioning variable, Row, is (1) A, (2) B, (3), C, and (4) D.
Based on the specification of the orderings of conditioning variables and the levels of each conditioning variable, the packets are ordered by the following rule: The levels of the first conditioning variable vary the fastest, the levels of the second conditioning variable vary the next fastest, and so forth. For Figure 11-12, the order of the packets is (1) 1 A, (2) 2 A, (3) 3 A, (4) 1 B, (5) 2 B, (6) 3 B, (7) 1 C, (8) 2 C, (9) 3 C, (10) 1 D, (11) 2 D, and (12) 3 D.
An order for panels in a page of a trellis display. There are 2 types of panel ordering rules. The first one is graph ordering: The bottom left panel of the first page is panel one; from there you move fastest through the columns, next fastest through the rows, and the slowest through pages. The following shows the panel order for a (3, 4, 1) trellis display using graph ordering:
The second one is table ordering. The only difference between table ordering and graph ordering is the position of panel one. Table ordering assigns panel one to the top left panel of the first page. The following shows the panel order for a (3, 4, 1) trellis display using table ordering:
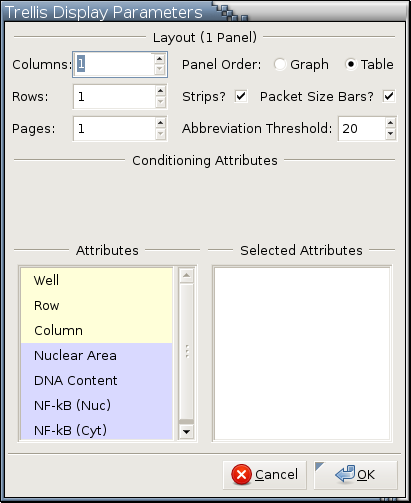
UI for Generating a Trellis Display
Plots supporting trellis display:
Scatterplot 2D Histogram Boxplot Table Plot Histogram Barplot Pie Chart Parallel Coordinate Plot Argument menu:
Example:
To get this menu, you have to make Trellis? checked and click the O.K. button in the argument menu of a plot supporting trellis display.
Categorical variables are displayed over a light yellow background (e.g.,
 ).
Numerical variables are displayed over
a light blue background
(e.g.,
).
Numerical variables are displayed over
a light blue background
(e.g.,
 ).
).
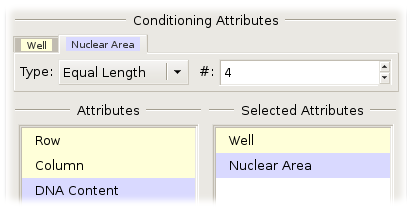
Selected variables are the conditioning variables of a trellis display. The first variable in the Selected Attributes column is the first conditioning variable, the second one is the second conditioning variable, and so forth.
Attributes in the left and the right columns are selected with Left , Ctrl-Left , and Shift-Left . See here for details.
Selected variables can be moved around (within the same column or across the 2 columns) with drag and drop, keyboard accelerators, and functions in the right-click menu that can be popped up over the 2 columns. See here for details.
The order of conditioning variables in the Selected Attributes column can be changed by drag and drop with the left mouse button.
For each variable in the Selected Attributes column, there is a tabbed page in the Conditioning Attributes field for you to control its levels. For example:
The page with the leftmost tab is for the first variable from the top in the Selected Attributes column, the page with the second leftmost tab is for the second variable from the top in the Selected Attributes column, and so forth. When the order of conditioning variables in the Selected Attributes column is changed, these pages will be reshuffled to reflect the new order. In addition to clicking the tab of a buried page to raise it to top, left click the corresponding variable in the Selected Attributes column will achieve the same effect.Pages for categorical variables in the Conditioning Attributes field:
Example:
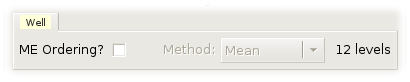
ME Ordering? is active and not grayed out only for trellis displays of scatterplots, 2D histograms, histograms, and boxplots. For trellis displays of scatterplots, 2D histograms, Varebi plots, and boxplots, it is the variable plotted along the vertical axis that is used to compute level main effects. ME stands for main-effects.
The Method option menu is only active and not grayed out if ME Ordering? is checked. It specifies how to compute level main effects. It has 2 choices: Mean and Median.
The number of categories of the corresponding categorical variable is printed to the left of the method option menu.
Pages for numerical variables in the Conditioning Attributes field:
Examples:
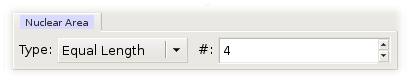
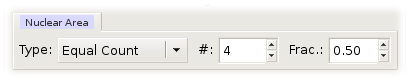
When a numerical variable is used as a conditioning variable, its range is broken up into intervals. These intervals become the levels of the numerical conditioning variable and are ordered. Argos can break a variable range into either equal-length or equal-count intervals.
Equal-length intervals are disjoint intervals of the same length. To form equal length intervals, you have to specify the number of such intervals.
Equal-count intervals are overlapping intervals. You need to specify the number of intervals and the approximate fraction of points shared by two successive intervals to form equal-count intervals. Argos then picks interval endpoints that are values of the data; the left endpoint of the lowest interval is the minimum of the data, and the right endpoint of the highest interval is the maximum of the data. The endpoints are chosen to make the counts of points in the intervals as nearly equal as possible, and the fractions of points shared by successive intervals as close to the specified fraction as possible. The overlap of the intervals increases the resolution with which you can study conditional dependence. A good analogy is moving averages for a time series.
Available modes:
 ,
,
 ,
,
 , and
, and
 .
.
Housekeeping functions:
For all trellis displays:
For trellis displays of scatterplots and Tukey sum-difference plots only: Add Lowess Curves and Add Linear Regression Lines
For trellis displays of histograms only: Set Histogram Number of Bins...
For trellis displays of scatterplots, 2D histograms, table plots, Varebi plots, and MST planing only: Switch XY
For trellis displays of boxplots and barplots only: Shuffle Categories...
For trellis displays of boxplots only: Summarize Boxplot Trellis
If a trellis display has many pages and you would like to delete them all at once, there are 2 ways to do it:
While pressing down the Ctrl key, invoke Delete in the right-click menu over any one of the nodes representing the pages in the scenegraph.
While pressing down the Ctrl key, click the close button in the title bar of any one of the pages. [2]