Spin
Arguments: Three numerical variables
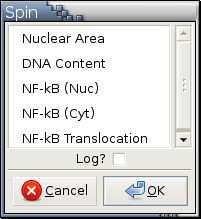
Argument menu:
Example:
Only numerical variables are listed in this menu.
This argument menu allows the selection of any number of variables with Left , Ctrl-Left , and Shift-Left . See here for details.
When you click the O.K. button, it will check to see if three variables are selected or not. It will pop up a reminder about what to do if the number of selected variables is not three.
If Log? is checked, the generated 3D point cloud rotation is based on the log2 transformation of the selected variables.
Housekeeping functions:
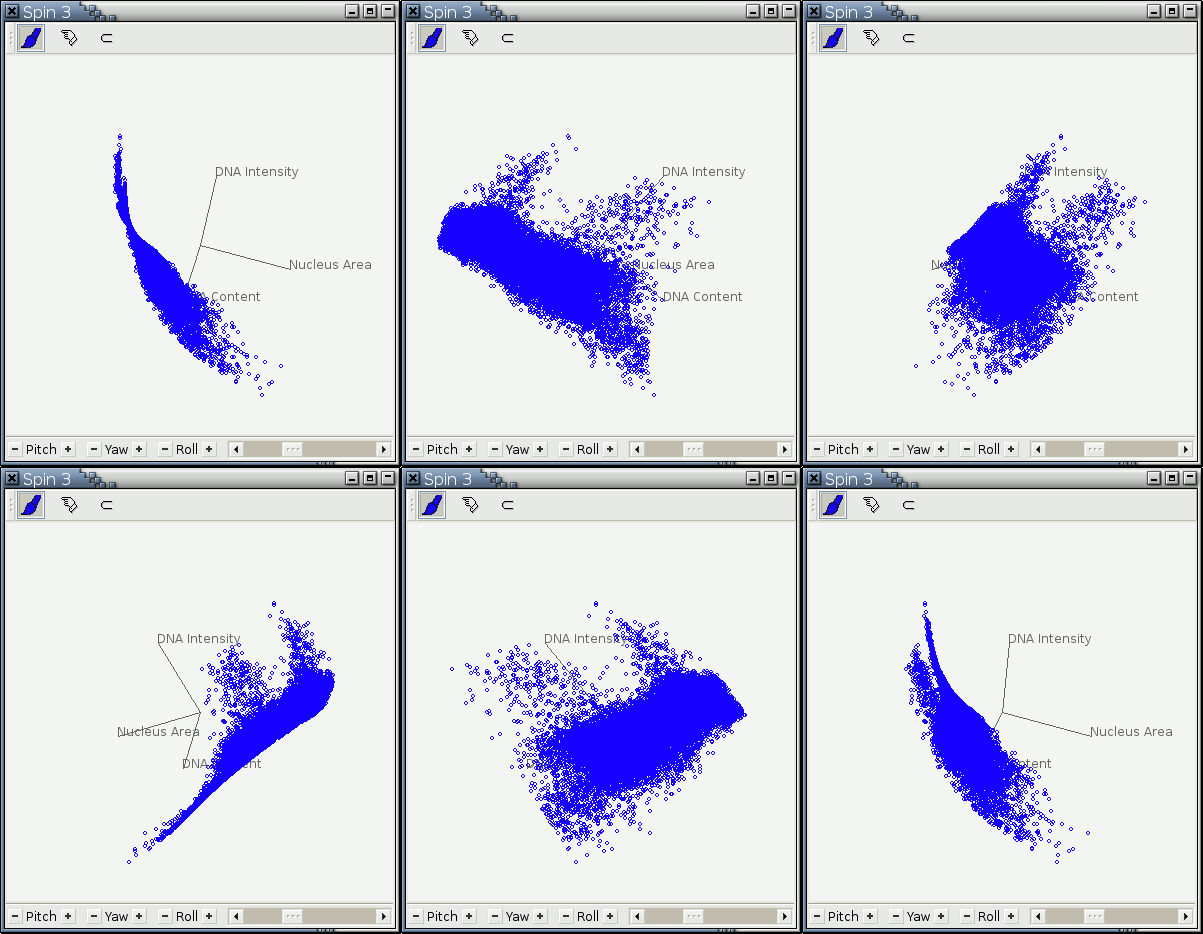
Example: Figure 11-11
To effectively operate a spin plot, a few terminologies have to be defined or clarified:
XYZ Coordinate System: The center of a Spin plot is the origin of this coordinate system. The horizontal line through the center of the plot is the X axis. The vertical line through the center is the Y axis. The Z axis is the line through the origin perpendicular to the computer screen; the positive half of the Z axis is pointing toward you. These 3 axes remain fixed no matter how you rotate a point cloud. A right-handed 3D coordinate system is used here. Positive rotations are such that, when looking from a positive axis toward the origin, a 90-degree counterclockwise rotation will transform one positive axis into the other.
Pitch, Yaw, and Roll: Pitch is rotation about the X axis. Yaw is rotation about the Y axis. Roll is rotation about the Z axis.
Data Coordinate System: This is specified by the 3 numerical variables selected for spinning. Axes of this coordinate system are rotated together with the associated point cloud. The origin of the data coordinate system is most likely not at the center of the spin plot. The center of the plot is the centroid of a point cloud and the point cloud is rotated around its centroid.
The slider in a Spin plot controls the speed of rotation.
The 3 line segments in a Spin plot indicate the orientation of the 3 data axes of the data coordinate system. The intersection of the 3 line segments is the centroid of the associated point cloud. Drawing of the 3 line segments can toggled on or off by invoking Show Orientation Indicators in the right-click menu over a spin plot.
You press the plus or minus button to start rotation in the positive or negative direction. A point cloud will keep rotating as long as the plus or minus button is pressed. The following keyboard accelerators can also be used to control rotation:
X [1] starts rotation around the X axis in the positive direction. Shift-X starts rotation around the X axis in the negative direction.
Y starts rotation around the Y axis in the positive direction. Shift-Y starts rotation around the Y axis in the negative direction.
Z starts rotation around the Z axis in the positive direction. Shift-Z starts rotation around the Z axis in the negative direction.
P and Shift-P achieve the same effect as X and Shift-X, respectively.
R and Shift-R achieve the same effect as Z and Shift-Z, respectively.
Just hit the space bar to stop rotation.
There are 3 ways to draw point icons in a Spin plot: as 1-pixel points, as 2-pixel-by-2-pixel rectangles, and as circles. Drawing circles is the most computing intensive and drawing 1-pixel points the least. On Linux machines, the default is always to draw circles because circles can handle overstriking better than points and rectangles and also because Linux machines can handle the computing needs of fast drawing lots of circles. Due to the inherent nature of Microsoft Windows systems, Argos will choose a point format based on the number of points [2] in a point cloud so that rotation speed is maintained at a point for viewers to recover 3D data structures visually. You can use Draw Points , Draw Circles , or Draw Rectangles in the right-click menu of a spin plot to change drawing format manually.
 | In order to create the illusion of rotation in a 3 dimensional space on a flat screen, a Spin plot has to update its display many times per second, which means drawing operations have to be as fast as possible. As it takes more time to draw objects of different shapes and sizes, a design decision was made to make all point icons in a Spin plot of the same shape and size. An implication of this design decision is that changing the size and shape drawing styles of observations will not have any effect on point icons in a Spin plot. On the other hand, operations Draw Points , Draw Circles , and Draw Rectangles only affect point icons in a Spin plot and do not have any effect on the drawing styles of the observations those point icons represent. |

