Histogram
Arguments: One numerical variable
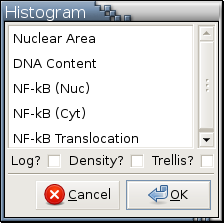
Argument menu:
Example:
Only numerical variables are listed in this menu.
This argument menu allows the selection of only one variable.
If Density? is checked, the histogram graphic is a representation of relative frequencies (probabilities).
If Density? is unchecked, the histogram graphic is a representation of frequencies (counts).
If Log? is checked, the generated histogram or histogram trellis display is based on the log2 transformation of the selected variable.
If Trellis? is checked, a histogram trellis display will be drawn.
Available modes:
 ,
,
 ,
,
 , and
, and
 .
.
Housekeeping functions:
Example: Figure 11-5
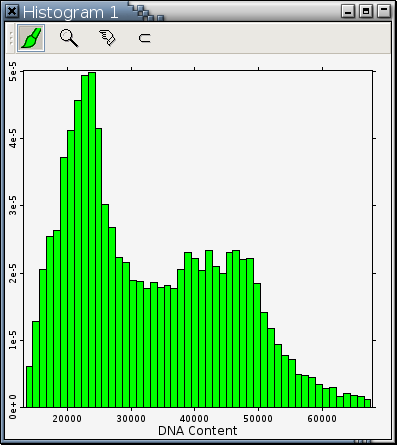
A histogram uses filled rectangles as agglomerative icons to represent groups of observation objects. The size of an agglomerative icon is proportional to the number of observation objects it represents. The colors of observation objects determine the appearance of the agglomerative icon representing them. For example, if 40% of the observations are yellow and the rest are green, 40% of the representing agglomerative icon will be filled with yellow and the rest filled with green.