List View
Available modes:
 and
and
 .
.
Housekeeping function:
Comment... Save as PNG Image... Set Background... Summarize Data Example: Figure 11-14
A list view is a simple spreadsheet-like viewport that is
totally integrated with the rest of Argos
and can be generated by the
List
button in the console or
by the
![]() mode.
mode.
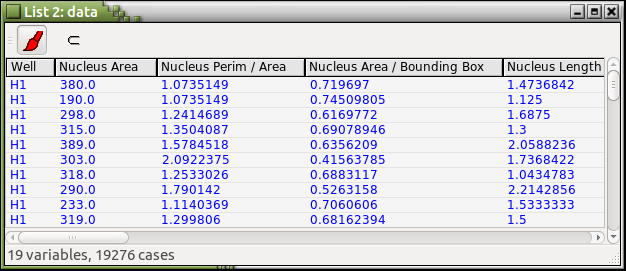
Each column corresponds to a variable of the data set being visualized. The number of columns is printed at the bottom of a list view. For example, there are 19 columns in Figure 11-14.
Each row in a list view represents an observation. The number of observations in a list view is printed at the bottom. For example, the number of observations in Figure 11-14 is 19276. You can paint rows in a list view and the icons of the painted observations in other viewports will update their colors accordingly. The effect of painting done in other viewports will show up in list views that contain the same observations. You can also retrieve data from a list view, send the retrieved data over to the temporary console, and carry out further analysis.
The ordering of rows from top to bottom in a list view
is initially the same as that of observations
in their original data set.
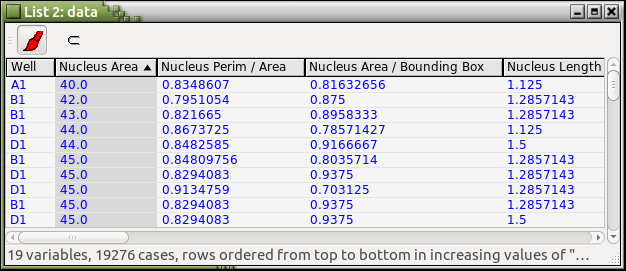
Clicking the left mouse button over a column label
will order rows from top to bottom in increasing order
of the clicked variable unless rows are already ordered
by the clicked variable.
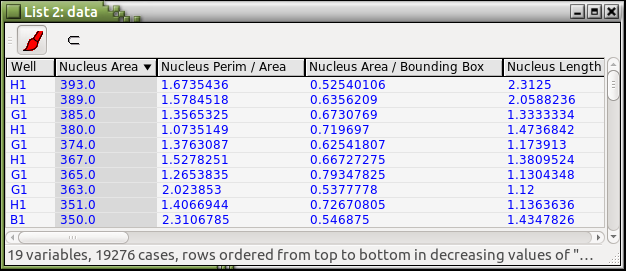
When rows are already ordered by a variable,
clicking that variable again will reverse the row ordering.
For example,
the list view in Figure 11-14
will look like the one in Figure 11-15
after the Nucleus Area column label is clicked.
Figure 11-15. Rows ordered from top to bottom in increasing values of
Nucleus Area
---> images/plot-list-view-triangle-up.png <---
Figure 11-16. Rows ordered from top to bottom in decreasing values of
Nucleus Area
---> images/plot-list-view-triangle-down.png <---