Pie Chart
Arguments: One categorical variable
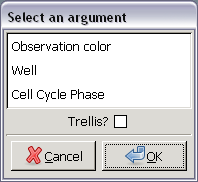
Argument menu:
Example:
Only categorical variables are listed in this menu.
This argument menu allows the selection of only one variable.
If Trellis? is checked, a trellis display of pie charts will be drawn.
Available modes:
 ,
,
 , and
, and
 .
.
Housekeeping function:
Abbreviate Categories... Categorize by Colors... Comment... Copy Save as PNG Image... Set Axis Labels... Set Background... Set Screen Size Same as... Set as Default Plot Size Summarize Data Example: Figure 11-8
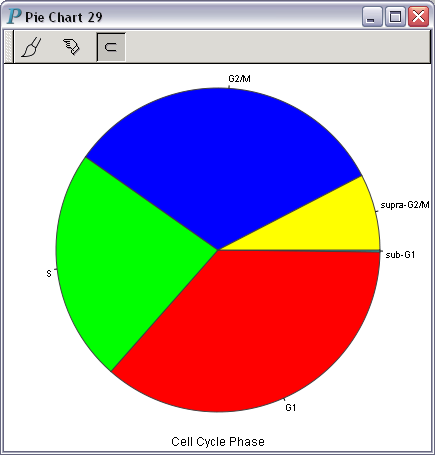
A pie chart is a circle divided into sectors, each of which corresponds to a category of the variable being plotted. The arc length of each sector (hence, its central angle and area) is proportional to the number of observations in the category corresponding to the sector.