Barplot
Arguments: One categorical variable
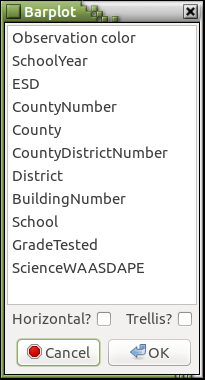
Argument menu:
Example:
Only categorical variables are listed in this menu.
This argument menu allows the selection of only one variable.
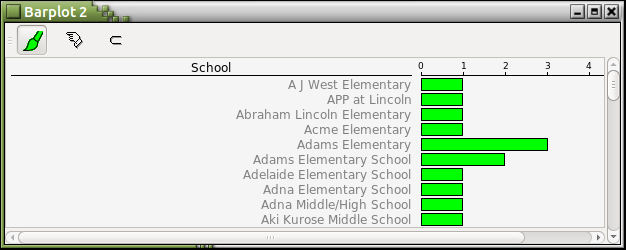
If Horizontal? is checked, a horizontal barplot will be drawn. When the categorical variable to be visualized with a barplot has long category names, it's better to check this and visualize it with a horizontal barplot. When this is checked, Trellis? will be grayed out and won't be sensitive to user input.
If Percentage? is checked,
If Trellis? is checked, a barplot trellis display will be drawn. When this is checked, Horizontal? will be grayed out and won't be sensitive to user input.
Available modes:
 ,
,
 , and
, and
 .
.
Housekeeping function:
Example: Figure 11-6
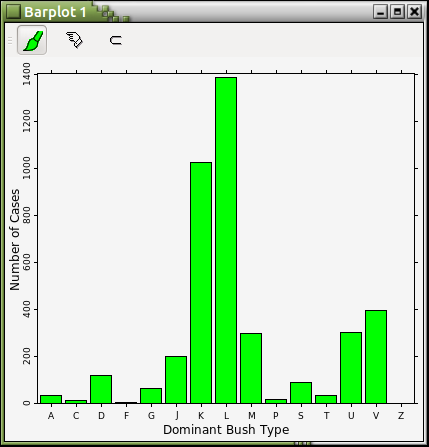
A barplot is very similar to a histogram in appearance but it's only for a single categorical variable. See here for a description of the agglomerative icons in barplots.
Even if Horizontal? is not checked,
Argos would still draw a horizontal barplot
[1]
for a categorical variable
whose number of categories in the data set being visualized
is greater than the value specified
by the :too-many-categories-threshold
preference,
which defaults to 50.
Figure 11-7
is such an example.