Table Plot
Arguments: Two categorical variables
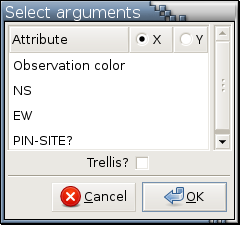
Argument menu:
Example:
Only categorical variables are listed in this menu.
This argument menu allows the selection of 1 variable as the X variable to be plotted along the horizontal axis and 1 variable as the Y variable to be plotted along the vertical axis.
If Trellis? is checked, a table plot trellis display will be drawn.
Available modes:
 ,
,
 , and
, and
 .
.
Housekeeping functions:,
Example: Figure 11-4
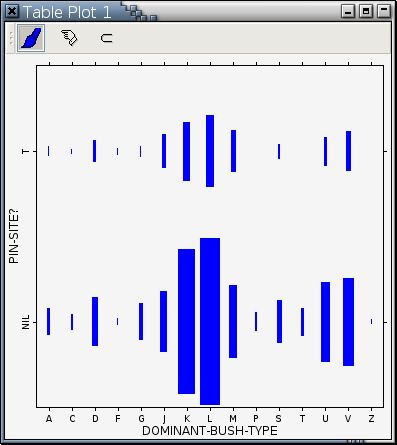
A table plot is very similar to a 2d histogram in appearance but it's only for 2 categorical variables. See here for a description of the agglomerative icons in table plots.